Games Jobs with Work from Home Options

Gaming
UK > Work from Home

The table below looks at the prevalence of the term Games in remote or hybrid work. Included is a benchmarking guide to the salaries offered in vacancies that cited Games over the 6 months leading up to 26 July 2024, comparing them to the same period in the previous two years.

6 months to
26 Jul 2024
Same period 2023 Same period 2022
Rank 226 256 93
Rank change year-on-year +30 -163 +51
Permanent jobs citing Games 388 417 3,240
As % of all permanent jobs with a WFH option 1.39% 1.27% 4.13%
As % of the General category 2.28% 1.95% 6.25%
Number of salaries quoted 236 343 1,163
10th Percentile £26,250 £40,000 £38,750
25th Percentile £41,813 £47,750 £52,500
Median annual salary (50th Percentile) £52,500 £65,000 £65,000
Median % change year-on-year -19.23% - +13.04%
75th Percentile £69,000 £85,000 £86,250
90th Percentile £83,125 £104,500 £100,000
UK median annual salary £55,000 £62,500 £65,000
% change year-on-year -12.00% -3.85% +13.04%

All General Skills
Work from Home

Games falls under the General Skills category. For comparison with the information above, the following table provides summary statistics for all permanent job vacancies with remote or hybrid options requiring common skills.

Permanent vacancies with a requirement for common skills 17,022 21,367 51,870
As % of all permanent jobs with a WFH option 60.93% 65.11% 66.05%
Number of salaries quoted 11,520 15,606 26,987
10th Percentile £32,500 £36,250 £35,000
25th Percentile £42,500 £46,570 £45,000
Median annual salary (50th Percentile) £57,500 £62,500 £60,000
Median % change year-on-year -8.00% +4.17% +7.14%
75th Percentile £77,500 £82,500 £80,000
90th Percentile £100,000 £102,500 £96,250
UK median annual salary £54,000 £60,000 £60,000
% change year-on-year -10.00% - +6.19%

Games
Trend for Jobs with a WFH Option

Job vacancies with a work from home option citing Games as a proportion of all IT jobs advertised.
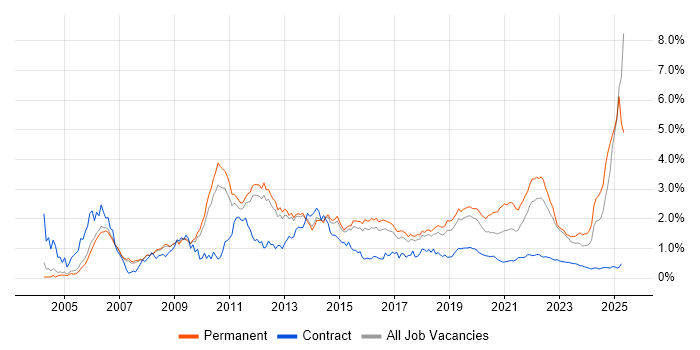
Games trend for jobs with a WFH option

Games
Salary Trend for Jobs with a WFH Option

3-month moving average salary quoted in job vacancies with a work from home option citing Games.

Games salary trend for jobs with a WFH option

Games
Salary Histogram for Jobs with a WFH Option

Salary distribution for jobs with a work from home option citing Games over the 6 months to 26 July 2024.

Games salary histogram for jobs with a WFH option

Games
Co-occurring Skills and Capabilities with WFH Options by Category

The follow tables expand on the table above by listing co-occurrences grouped by category. The same employment type, locality and period is covered with up to 20 co-occurrences shown in each of the following categories:

Application Platforms
1 35 (9.02%) Microsoft Exchange
2 12 (3.09%) Apache Spark
3 7 (1.80%) Apache Solr
4 4 (1.03%) Apache
4 4 (1.03%) Exchange Server 2000
5 3 (0.77%) Apache Airflow
5 3 (0.77%) CMS
6 2 (0.52%) Confluence
6 2 (0.52%) Jupyter
6 2 (0.52%) WordPress
7 1 (0.26%) Exchange Server 2010
7 1 (0.26%) SharePoint
Applications
1 7 (1.80%) Microsoft Office
2 5 (1.29%) Adobe After Effects
2 5 (1.29%) Microsoft Project
3 4 (1.03%) Adobe Creative Suite
3 4 (1.03%) Blender
3 4 (1.03%) Photoshop
4 3 (0.77%) S-PLUS
5 2 (0.52%) Adobe Illustrator
5 2 (0.52%) Maya
5 2 (0.52%) Microsoft PowerPoint
5 2 (0.52%) Simulink
5 2 (0.52%) Stateflow
5 2 (0.52%) ZBrush
6 1 (0.26%) 3ds Max
6 1 (0.26%) Adobe XD
6 1 (0.26%) Microsoft Excel
6 1 (0.26%) Sketch
Business Applications
1 24 (6.19%) Endur
2 2 (0.52%) Elite 3E
3 1 (0.26%) OpenLink RightAngle
Cloud Services
1 52 (13.40%) Azure
2 48 (12.37%) AWS
3 19 (4.90%) Microsoft 365
4 17 (4.38%) SaaS
5 10 (2.58%) Google Workspace
6 9 (2.32%) Amazon S3
6 9 (2.32%) Asana
7 7 (1.80%) AWS Lambda
7 7 (1.80%) Azure DevOps
7 7 (1.80%) Serverless
8 6 (1.55%) GCP
9 5 (1.29%) Amazon ElastiCache
9 5 (1.29%) AWS CloudFormation
9 5 (1.29%) GitHub
10 4 (1.03%) Amazon ECS
10 4 (1.03%) Amazon Kinesis
10 4 (1.03%) AWS Elastic Beanstalk
11 3 (0.77%) dbt
11 3 (0.77%) Mavenlink
11 3 (0.77%) Power Platform
Communications & Networking
1 26 (6.70%) Wireless
2 21 (5.41%) 3GPP
2 21 (5.41%) 5G
2 21 (5.41%) Radio Access Network
3 14 (3.61%) Broadband
3 14 (3.61%) Internet
4 13 (3.35%) Firewall
5 10 (2.58%) DNS
6 9 (2.32%) NAS
7 8 (2.06%) HTTP
8 7 (1.80%) Wi-Fi
9 1 (0.26%) DHCP
9 1 (0.26%) LAN
9 1 (0.26%) SAN
9 1 (0.26%) SMS
9 1 (0.26%) SSH
9 1 (0.26%) TCP/IP
9 1 (0.26%) VPN
Database & Business Intelligence
1 59 (15.21%) SQL Server
2 32 (8.25%) Relational Database
3 31 (7.99%) RDBMS
4 18 (4.64%) MySQL
5 15 (3.87%) Elasticsearch
6 11 (2.84%) PostgreSQL
7 8 (2.06%) MongoDB
7 8 (2.06%) Redis
8 7 (1.80%) NoSQL
9 6 (1.55%) Azure SQL Database
10 5 (1.29%) Amazon RDS
10 5 (1.29%) Data Lake
10 5 (1.29%) DynamoDB
10 5 (1.29%) Enterprise Data Warehouse
11 4 (1.03%) Couchbase
11 4 (1.03%) DTS
12 3 (0.77%) Amazon Redshift
12 3 (0.77%) Data Mining
12 3 (0.77%) Power BI
13 2 (0.52%) Presto
Development Applications
1 21 (5.41%) Git
2 12 (3.09%) JIRA
3 8 (2.06%) TeamCity
4 6 (1.55%) Bitbucket
5 5 (1.29%) Jenkins
5 5 (1.29%) JMeter
5 5 (1.29%) Maven
5 5 (1.29%) Zephyr
6 4 (1.03%) Team Foundation Server
7 3 (0.77%) GitLab
7 3 (0.77%) gulp
7 3 (0.77%) webpack
8 2 (0.52%) Cypress.io
8 2 (0.52%) Grunt
8 2 (0.52%) Octopus Deploy
8 2 (0.52%) Postman
8 2 (0.52%) SonarQube
8 2 (0.52%) Storybook
8 2 (0.52%) Vite
9 1 (0.26%) rollup.js
General
1 117 (30.15%) Social Skills
2 73 (18.81%) Finance
3 65 (16.75%) Inclusion and Diversity
4 43 (11.08%) Marketing
5 37 (9.54%) Retail
6 35 (9.02%) Analytical Skills
7 23 (5.93%) Billing
8 21 (5.41%) Telecoms
9 19 (4.90%) Manufacturing
10 18 (4.64%) Influencing Skills
11 16 (4.12%) Advertising
11 16 (4.12%) Aerospace
12 12 (3.09%) Electronics
13 7 (1.80%) Legal
14 4 (1.03%) iGaming
14 4 (1.03%) Law
15 3 (0.77%) Public Sector
16 2 (0.52%) Documentation Skills
17 1 (0.26%) Organisational Skills
17 1 (0.26%) Police
Job Titles
1 98 (25.26%) Developer
1 98 (25.26%) Senior
2 45 (11.60%) Project Manager
3 34 (8.76%) .NET Developer
4 33 (8.51%) Software Engineer
5 27 (6.96%) Senior Developer
6 23 (5.93%) Infrastructure Engineer
6 23 (5.93%) Senior Software Engineer
7 22 (5.67%) Senior Manager
8 20 (5.15%) Lead
9 19 (4.90%) C# Developer
9 19 (4.90%) Games Developer
10 17 (4.38%) Full Stack Developer
11 15 (3.87%) Software Manager
12 14 (3.61%) Architect
12 14 (3.61%) Development Manager
12 14 (3.61%) PHP Developer
13 13 (3.35%) C# .NET Developer
13 13 (3.35%) OpenLink Manager
13 13 (3.35%) Software Development Manager
Libraries, Frameworks & Software Standards
1 53 (13.66%) .NET
2 51 (13.14%) HTML
3 35 (9.02%) .NET Core
4 33 (8.51%) React
5 31 (7.99%) Node.js
6 29 (7.47%) AngularJS
7 28 (7.22%) CSS
8 25 (6.44%) ASP.NET
9 23 (5.93%) .NET Framework
10 22 (5.67%) ASP.NET MVC
11 19 (4.90%) Entity Framework
12 17 (4.38%) HTML5
13 15 (3.87%) JSON
13 15 (3.87%) RESTful
14 14 (3.61%) ASP.NET Web API
14 14 (3.61%) Vue
15 12 (3.09%) RabbitMQ
15 12 (3.09%) Unity (Game Engine)
16 11 (2.84%) Blazor
16 11 (2.84%) Kafka
Miscellaneous
1 31 (7.99%) Management Information System
2 24 (6.19%) Swaptions
3 16 (4.12%) Online Games
4 15 (3.87%) Client/Server
5 12 (3.09%) Distributed Systems
5 12 (3.09%) IoT
6 11 (2.84%) Onboarding
7 10 (2.58%) Video Conferencing
8 9 (2.32%) Greenfield Project
8 9 (2.32%) Hedge funds
9 8 (2.06%) Animation
10 7 (1.80%) Data Structures
10 7 (1.80%) Linux Command Line
10 7 (1.80%) Self-Motivation
10 7 (1.80%) Virtual Team
11 6 (1.55%) Algorithms
11 6 (1.55%) Mobile Games
11 6 (1.55%) Virtual Reality
12 5 (1.29%) Enterprise Cloud
12 5 (1.29%) Product Ownership
Operating Systems
1 27 (6.96%) Windows
2 18 (4.64%) Linux
3 10 (2.58%) Mac OS
3 10 (2.58%) Windows Server
4 5 (1.29%) Windows 10
5 4 (1.03%) Android
6 3 (0.77%) Apple iOS
7 2 (0.52%) Unix
8 1 (0.26%) Mac OS X
Processes & Methodologies
1 105 (27.06%) Agile
2 58 (14.95%) Project Management
3 52 (13.40%) Full Stack Development
3 52 (13.40%) Problem-Solving
4 48 (12.37%) Mentoring
5 43 (11.08%) Software Engineering
6 39 (10.05%) Decision-Making
7 37 (9.54%) Computer Science
8 36 (9.28%) Scrum
9 35 (9.02%) Creative Thinking
10 34 (8.76%) Roadmaps
10 34 (8.76%) SDLC
11 33 (8.51%) Infrastructure Engineering
12 32 (8.25%) Customer Experience
13 30 (7.73%) MVC
14 29 (7.47%) Data Modelling
15 28 (7.22%) Customer Service
16 27 (6.96%) Analytics
16 27 (6.96%) Machine Learning
17 26 (6.70%) Microservices
Programming Languages
1 78 (20.10%) JavaScript
2 54 (13.92%) C#
3 52 (13.40%) Python
4 43 (11.08%) SQL
5 41 (10.57%) Java
6 30 (7.73%) TypeScript
7 24 (6.19%) VB
8 20 (5.15%) C++
9 19 (4.90%) PHP
10 14 (3.61%) Bash
11 8 (2.06%) C
12 6 (1.55%) Go
12 6 (1.55%) Scala
13 5 (1.29%) Groovy
13 5 (1.29%) T-SQL
14 2 (0.52%) MATLAB
15 1 (0.26%) Kotlin
15 1 (0.26%) Perl
15 1 (0.26%) Swift
Qualifications
1 96 (24.74%) Degree
2 51 (13.14%) Security Cleared
3 33 (8.51%) DBS Check
4 20 (5.15%) SC Cleared
5 18 (4.64%) Computer Science Degree
6 7 (1.80%) BPSS Clearance
7 5 (1.29%) PMI Certification
7 5 (1.29%) PMP
8 4 (1.03%) ITIL Foundation Certificate
9 3 (0.77%) PhD
10 2 (0.52%) Master's Degree
11 1 (0.26%) ITIL Certification
11 1 (0.26%) MBA
11 1 (0.26%) NVQ Level 3
11 1 (0.26%) Six Sigma Green Belt
Quality Assurance & Compliance
1 23 (5.93%) QA
2 11 (2.84%) ISO/IEC 27001
3 9 (2.32%) Cyber Essentials
3 9 (2.32%) SOC 2
4 6 (1.55%) GDPR
5 4 (1.03%) SLA
6 3 (0.77%) Data Quality
7 2 (0.52%) NIST
8 1 (0.26%) Accessibility
8 1 (0.26%) ITGC
8 1 (0.26%) NEBOSH
8 1 (0.26%) PMO
8 1 (0.26%) Sarbanes-Oxley
System Software
1 22 (5.67%) Docker
2 18 (4.64%) Active Directory
3 9 (2.32%) VMware Infrastructure
Systems Management
1 15 (3.87%) Kubernetes
2 9 (2.32%) Single Sign-On
3 8 (2.06%) Terraform
4 7 (1.80%) Microsoft Intune
5 3 (0.77%) Progress Chef
6 2 (0.52%) Ansible
6 2 (0.52%) Argo
7 1 (0.26%) Grafana
7 1 (0.26%) Prometheus
7 1 (0.26%) Puppet
Vendors
1 60 (15.46%) Microsoft
2 27 (6.96%) Google
3 25 (6.44%) Oracle
4 24 (6.19%) OpenLink
4 24 (6.19%) Sybase
4 24 (6.19%) TIBCO
5 22 (5.67%) Apple
6 19 (4.90%) IFS
7 17 (4.38%) Workday
8 12 (3.09%) Adobe
9 9 (2.32%) VMware
10 4 (1.03%) Cisco
10 4 (1.03%) Dell
10 4 (1.03%) Draytek
10 4 (1.03%) Logitech
10 4 (1.03%) YouTube
11 3 (0.77%) CrowdStrike
11 3 (0.77%) Instagram
11 3 (0.77%) Salesforce
12 2 (0.52%) Facebook