QA Jobs with Work from Home Options

Quality Assurance (QA)
UK > Work from Home

The table below provides summary statistics for permanent remote or hybrid work requiring QA skills. It includes a benchmarking guide to the annual salaries offered in vacancies that cited QA over the 6 months leading up to 26 July 2024, comparing them to the same period in the previous two years.

6 months to
26 Jul 2024
Same period 2023 Same period 2022
Rank 75 60 50
Rank change year-on-year -15 -10 +18
Permanent jobs citing QA 1,049 1,565 5,200
As % of all permanent jobs with a WFH option 3.75% 4.77% 6.62%
As % of the Quality Assurance & Compliance category 28.79% 33.40% 41.19%
Number of salaries quoted 664 1,151 2,449
10th Percentile £40,000 £37,500 £36,250
25th Percentile £46,250 £46,250 £45,000
Median annual salary (50th Percentile) £57,500 £60,000 £59,000
Median % change year-on-year -4.17% +1.69% +12.38%
75th Percentile £70,000 £78,375 £73,750
90th Percentile £82,500 £95,000 £92,500
UK median annual salary £52,500 £60,000 £57,500
% change year-on-year -12.50% +4.35% +4.55%

All Quality Assurance and Compliance Skills
Work from Home

QA falls under the Quality Assurance and Compliance category. For comparison with the information above, the following table provides summary statistics for all permanent job vacancies with remote or hybrid options requiring quality assurance or compliance skills.

Permanent vacancies with a requirement for quality assurance or compliance skills 3,644 4,686 12,625
As % of all permanent jobs with a WFH option 13.04% 14.28% 16.08%
Number of salaries quoted 2,573 3,463 6,469
10th Percentile £35,050 £37,500 £32,500
25th Percentile £45,000 £45,750 £42,500
Median annual salary (50th Percentile) £58,457 £60,000 £57,500
Median % change year-on-year -2.57% +4.35% +9.52%
75th Percentile £77,500 £77,500 £73,000
90th Percentile £97,500 £92,500 £90,000
UK median annual salary £53,500 £57,500 £55,000
% change year-on-year -6.96% +4.55% +2.33%

QA
Trend for Jobs with a WFH Option

Job vacancies with a work from home option citing QA as a proportion of all IT jobs advertised.
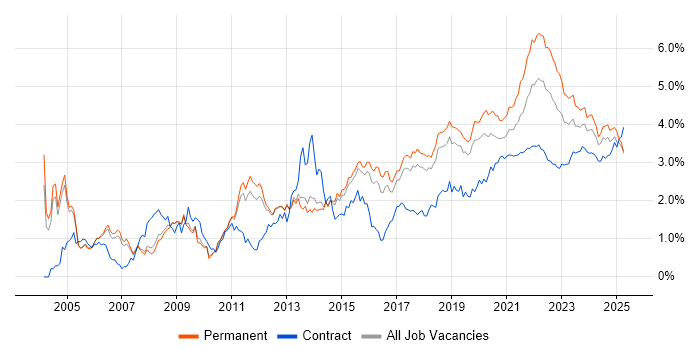
QA trend for jobs with a WFH option

QA
Salary Trend for Jobs with a WFH Option

3-month moving average salary quoted in job vacancies with a work from home option citing QA.

QA salary trend for jobs with a WFH option

QA
Salary Histogram for Jobs with a WFH Option

Salary distribution for jobs with a work from home option citing QA over the 6 months to 26 July 2024.

QA salary histogram for jobs with a WFH option

QA
Co-occurring Skills and Capabilities with WFH Options by Category

The follow tables expand on the table above by listing co-occurrences grouped by category. The same employment type, locality and period is covered with up to 20 co-occurrences shown in each of the following categories:

Application Platforms
1 39 (3.72%) IIS
2 27 (2.57%) Confluence
3 24 (2.29%) SharePoint
4 12 (1.14%) Documentum
5 4 (0.38%) Apache Spark
5 4 (0.38%) CMS
6 3 (0.29%) Apache Solr
6 3 (0.29%) Drupal
6 3 (0.29%) Microsoft Exchange
7 2 (0.19%) Apache
7 2 (0.19%) BizTalk Server
7 2 (0.19%) Moodle
7 2 (0.19%) Umbraco
7 2 (0.19%) WordPress
8 1 (0.095%) Adobe Experience Manager
8 1 (0.095%) SAS
8 1 (0.095%) SharePoint 2010
8 1 (0.095%) Sitecore CMS
Applications
1 46 (4.39%) Microsoft Office
2 25 (2.38%) Microsoft Excel
3 11 (1.05%) Microsoft PowerPoint
4 9 (0.86%) Microsoft Project
5 6 (0.57%) InfoPath
6 3 (0.29%) Trello
7 2 (0.19%) Notion
7 2 (0.19%) Sketch
8 1 (0.095%) Adobe Captivate
8 1 (0.095%) Adobe Creative Suite
8 1 (0.095%) Adobe Illustrator
8 1 (0.095%) AutoCAD
8 1 (0.095%) Blender
8 1 (0.095%) MS Visio
8 1 (0.095%) Photoshop
8 1 (0.095%) Revit
8 1 (0.095%) UXPin
8 1 (0.095%) Zeplin
Business Applications
1 31 (2.96%) SAP S/4HANA
2 29 (2.76%) Dynamics CRM
3 15 (1.43%) NEC Housing
4 12 (1.14%) TrackWise
5 8 (0.76%) SAP FI
6 7 (0.67%) SAP CO
7 6 (0.57%) SAP FI/CO
7 6 (0.57%) SAP FI-AP
8 5 (0.48%) SAP Payroll
9 4 (0.38%) SAP SD
10 3 (0.29%) SAP MM
11 2 (0.19%) Endur
11 2 (0.19%) Findur
11 2 (0.19%) Odoo
11 2 (0.19%) SAP EWM
11 2 (0.19%) SAP MII
11 2 (0.19%) SAP WM
11 2 (0.19%) Shopify
12 1 (0.095%) Payment Gateway
12 1 (0.095%) SAP Travel Management
Cloud Services
1 220 (20.97%) Azure
2 99 (9.44%) AWS
3 98 (9.34%) SaaS
4 90 (8.58%) Azure DevOps
5 63 (6.01%) Power Platform
6 42 (4.00%) Dynamics 365
7 26 (2.48%) Microsoft 365
7 26 (2.48%) Power Automate
8 23 (2.19%) GCP
8 23 (2.19%) GitHub
9 20 (1.91%) PowerApps
9 20 (1.91%) Serverless
10 13 (1.24%) SuccessFactors
11 12 (1.14%) Azure Service Bus
12 10 (0.95%) Azure Logic Apps
13 9 (0.86%) Azure Data Factory
13 9 (0.86%) Azure Stack
13 9 (0.86%) BrowserStack
13 9 (0.86%) PaaS
14 8 (0.76%) Azure Functions
Communications & Networking
1 17 (1.62%) Firewall
2 8 (0.76%) Internet
3 5 (0.48%) Remote Desktop
4 3 (0.29%) HTTP
4 3 (0.29%) Radio Access Network
5 2 (0.19%) VLAN
6 1 (0.095%) BGP
6 1 (0.095%) DHCP
6 1 (0.095%) DNS
6 1 (0.095%) FlexRay
6 1 (0.095%) HSRP
6 1 (0.095%) Intranet
6 1 (0.095%) MQTT
6 1 (0.095%) RS-485
6 1 (0.095%) VPN
6 1 (0.095%) Wi-Fi
Database & Business Intelligence
1 90 (8.58%) SQL Server
2 25 (2.38%) Power BI
3 22 (2.10%) Relational Database
4 21 (2.00%) MongoDB
5 19 (1.81%) PostgreSQL
6 15 (1.43%) MySQL
7 14 (1.33%) Data Warehouse
7 14 (1.33%) NoSQL
8 13 (1.24%) SQL Server Integration Services
8 13 (1.24%) SQL Server Reporting Services
9 9 (0.86%) Redis
10 8 (0.76%) Big Data
11 6 (0.57%) Power Query
11 6 (0.57%) SQL Server Analysis Services
12 5 (0.48%) Tableau
13 3 (0.29%) Azure SQL Database
13 3 (0.29%) BusinessObjects Web Intelligence
13 3 (0.29%) DynamoDB
13 3 (0.29%) Hadoop
13 3 (0.29%) SAP Data Services
Development Applications
1 86 (8.20%) JIRA
2 85 (8.10%) Selenium
3 62 (5.91%) Git
4 58 (5.53%) Postman
5 42 (4.00%) Cypress.io
6 38 (3.62%) Jenkins
7 35 (3.34%) Cucumber
8 28 (2.67%) Jasmine
8 28 (2.67%) Karma Test Runner
9 26 (2.48%) SpecFlow
10 23 (2.19%) JUnit
11 22 (2.10%) Visual Studio
12 18 (1.72%) TeamCity
13 17 (1.62%) JMeter
14 14 (1.33%) Bitbucket
15 13 (1.24%) GitLab
15 13 (1.24%) WebDriver
16 12 (1.14%) Appium
17 9 (0.86%) SoapUI
17 9 (0.86%) TestRail
General
1 374 (35.65%) Social Skills
2 168 (16.02%) Finance
3 151 (14.39%) Legal
4 146 (13.92%) Retail
5 136 (12.96%) Analytical Skills
6 76 (7.24%) Public Sector
7 75 (7.15%) Marketing
8 54 (5.15%) Manufacturing
9 48 (4.58%) Inclusion and Diversity
10 39 (3.72%) Telecoms
11 35 (3.34%) Pharmaceutical
12 27 (2.57%) Aerospace
12 27 (2.57%) Influencing Skills
12 27 (2.57%) Police
13 26 (2.48%) Law
14 25 (2.38%) Banking
14 25 (2.38%) Organisational Skills
15 23 (2.19%) Games
16 20 (1.91%) Local Government
17 19 (1.81%) Electronics
Job Titles
1 192 (18.30%) Developer
2 161 (15.35%) Lead
3 137 (13.06%) Senior
4 129 (12.30%) Analyst
5 85 (8.10%) Business Analyst
6 68 (6.48%) QA Manager
7 66 (6.29%) QA Engineer
8 62 (5.91%) Project Manager
9 52 (4.96%) C# Developer
9 52 (4.96%) Tester
10 43 (4.10%) Team Leader
11 40 (3.81%) Quality Manager
11 40 (3.81%) Software Engineer
12 36 (3.43%) Lead Business Analyst
13 34 (3.24%) Architect
13 34 (3.24%) Business Analyst Team Leader
14 30 (2.86%) Lead Developer
14 30 (2.86%) Software Developer
15 27 (2.57%) Senior Developer
16 26 (2.48%) .NET Developer
Libraries, Frameworks & Software Standards
1 124 (11.82%) .NET
2 73 (6.96%) AngularJS
3 69 (6.58%) React
4 68 (6.48%) REST
5 65 (6.20%) HTML
6 64 (6.10%) CSS
7 58 (5.53%) XML
8 54 (5.15%) Web Services
9 41 (3.91%) ASP.NET
9 41 (3.91%) JSON
10 38 (3.62%) .NET Framework
10 38 (3.62%) SOAP
11 36 (3.43%) RESTful
12 30 (2.86%) Sass
12 30 (2.86%) XML Schema
13 28 (2.67%) RxJS
14 24 (2.29%) Spring
15 21 (2.00%) .NET Core
15 21 (2.00%) Playwright
16 18 (1.72%) jQuery
Miscellaneous
1 62 (5.91%) Product Ownership
2 42 (4.00%) Management Information System
3 38 (3.62%) Life Science
4 34 (3.24%) Mobile App
5 24 (2.29%) Self-Motivation
6 14 (1.33%) Analytical Mindset
6 14 (1.33%) Client/Server
7 13 (1.24%) Blog
7 13 (1.24%) Data Structures
7 13 (1.24%) Legacy Systems
7 13 (1.24%) LIMS
8 12 (1.14%) Cloud Native
8 12 (1.14%) Low-Code
9 11 (1.05%) Satnav
10 9 (0.86%) Algorithms
10 9 (0.86%) Data Centre
10 9 (0.86%) Greenfield Project
11 8 (0.76%) Enterprise Software
11 8 (0.76%) Onboarding
11 8 (0.76%) PropTech
Operating Systems
1 51 (4.86%) Windows
2 44 (4.19%) Android
3 43 (4.10%) Apple iOS
4 35 (3.34%) Linux
5 5 (0.48%) AIX
6 4 (0.38%) VMS
7 3 (0.29%) Debian
7 3 (0.29%) Ubuntu
7 3 (0.29%) Windows Server
8 2 (0.19%) Unix
9 1 (0.095%) Embedded Linux
9 1 (0.095%) Mac OS
9 1 (0.095%) Mac OS X
Processes & Methodologies
1 385 (36.70%) Agile
2 254 (24.21%) Problem-Solving
3 214 (20.40%) Test Automation
4 199 (18.97%) Software Testing
5 195 (18.59%) DevOps
6 164 (15.63%) Coaching
7 160 (15.25%) SDLC
8 153 (14.59%) Continuous Improvement
9 152 (14.49%) Mentoring
10 143 (13.63%) Project Management
11 129 (12.30%) CI/CD
12 117 (11.15%) Scrum
13 107 (10.20%) Process Improvement
14 97 (9.25%) ITIL
15 94 (8.96%) Requirements Analysis
16 92 (8.77%) Business Analysis
16 92 (8.77%) Resource Allocation
16 92 (8.77%) Software Engineering
17 89 (8.48%) Roadmaps
18 88 (8.39%) Impact Assessments
Programming Languages
1 200 (19.07%) JavaScript
2 155 (14.78%) C#
3 131 (12.49%) SQL
4 103 (9.82%) Python
5 76 (7.24%) Java
6 72 (6.86%) TypeScript
7 31 (2.96%) T-SQL
8 30 (2.86%) VB
9 28 (2.67%) VB.NET
9 28 (2.67%) VB6
10 24 (2.29%) PHP
11 17 (1.62%) C
12 16 (1.53%) C++
13 13 (1.24%) Kotlin
14 12 (1.14%) Go
15 11 (1.05%) Swift
16 7 (0.67%) PowerShell
17 4 (0.38%) Bash
18 3 (0.29%) Data Analysis Expressions
18 3 (0.29%) Ruby
Qualifications
1 223 (21.26%) Degree
2 104 (9.91%) Security Cleared
3 51 (4.86%) SC Cleared
4 42 (4.00%) DBS Check
5 37 (3.53%) Computer Science Degree
6 31 (2.96%) ISTQB
7 28 (2.67%) DV Cleared
8 13 (1.24%) PMI Certification
9 12 (1.14%) Azure Certification
10 11 (1.05%) PMP
11 10 (0.95%) Microsoft Certification
12 9 (0.86%) Master's Degree
13 7 (0.67%) CSPO
14 6 (0.57%) BPSS Clearance
14 6 (0.57%) IIBA
14 6 (0.57%) ISTQB Foundation Certification
14 6 (0.57%) Numerate Degree
14 6 (0.57%) PRINCE2 Practitioner
15 5 (0.48%) AWS Certification
16 4 (0.38%) ITIL Certification
Quality Assurance & Compliance
1 44 (4.19%) Accessibility
2 25 (2.38%) ISO 9001
2 25 (2.38%) PMO
3 20 (1.91%) GMP
4 18 (1.72%) Good Clinical Practice
5 16 (1.53%) Software Quality Assurance
6 15 (1.43%) ISO/IEC 27001
7 13 (1.24%) Data Quality
8 12 (1.14%) GxP
9 11 (1.05%) GDPR
9 11 (1.05%) NEBOSH
10 10 (0.95%) ISO 14001
10 10 (0.95%) ISO 22301
11 5 (0.48%) GLP
12 3 (0.29%) SLA
13 2 (0.19%) PCI DSS
14 1 (0.095%) ISO 13485
14 1 (0.095%) ISO 26262
14 1 (0.095%) MISRA
14 1 (0.095%) P3O
System Software
1 59 (5.62%) Docker
2 7 (0.67%) Virtual Desktop
3 5 (0.48%) Firmware
4 3 (0.29%) Active Directory
4 3 (0.29%) Embedded Firmware
5 2 (0.19%) VMware Infrastructure
Systems Management
1 49 (4.67%) Kubernetes
2 19 (1.81%) Ansible
3 16 (1.53%) Terraform
4 13 (1.24%) Docker Swarm
5 5 (0.48%) Grafana
5 5 (0.48%) Kibana
5 5 (0.48%) Microsoft Intune
6 4 (0.38%) HP Quality Center
7 3 (0.29%) Podman
7 3 (0.29%) Puppet
8 1 (0.095%) Kubeflow
8 1 (0.095%) SCCM
Vendors
1 167 (15.92%) Microsoft
2 57 (5.43%) SAP
3 34 (3.24%) ServiceNow
4 15 (1.43%) NEC
4 15 (1.43%) Oracle
5 14 (1.33%) BT
5 14 (1.33%) Google
6 8 (0.76%) Salesforce
7 7 (0.67%) CheckPoint
8 6 (0.57%) Aderant
8 6 (0.57%) Databricks
9 5 (0.48%) Adobe
10 4 (0.38%) HP
10 4 (0.38%) Splunk
10 4 (0.38%) Thales
11 3 (0.29%) Ariba
11 3 (0.29%) MuleSoft
11 3 (0.29%) Sybase
11 3 (0.29%) Twitter
12 2 (0.19%) Citrix