Google Jobs with Hybrid/Remote/WFH Options

Google
UK > Work from Home

The table below provides summary statistics for permanent remote or hybrid work requiring knowledge or experience of Google products and/or services. It includes a benchmarking guide to the annual salaries offered in vacancies that cited Google over the 6 months leading up to 19 June 2025, comparing them to the same period in the previous two years.

The figures below represent the IT labour market in general and are not representative of salaries within Google.

6 months to
19 Jun 2025
Same period 2024 Same period 2023
Rank 38 124 88
Rank change year-on-year +86 -36 -27
Permanent jobs citing Google 1,264 865 1,267
As % of all permanent jobs with a WFH option 6.45% 2.42% 3.42%
As % of the Vendors category 12.97% 6.16% 8.63%
Number of salaries quoted 297 660 766
10th Percentile £32,100 £30,225 £40,000
25th Percentile £37,500 £41,250 £47,500
Median annual salary (50th Percentile) £57,500 £55,000 £66,802
Median % change year-on-year +4.55% -17.67% +6.88%
75th Percentile £81,250 £77,500 £87,500
90th Percentile £96,150 £88,750 £107,500
UK median annual salary £57,443 £54,000 £63,500
% change year-on-year +6.38% -14.96% +1.60%

All Vendors
Work from Home

Google falls under the Vendor Products and Services category. For comparison with the information above, the following table provides summary statistics for all permanent job vacancies with a remote or hybrid options requiring knowledge or experience of all vendor products and services.

Permanent vacancies with a requirement for knowledge or experience of vendor products and services 9,746 14,050 14,679
As % of all permanent jobs with a WFH option 49.73% 39.27% 39.68%
Number of salaries quoted 4,803 9,887 10,388
10th Percentile £25,084 £31,250 £33,232
25th Percentile £31,250 £41,250 £43,750
Median annual salary (50th Percentile) £55,000 £55,000 £60,000
Median % change year-on-year - -8.33% +4.35%
75th Percentile £70,600 £70,300 £77,500
90th Percentile £90,750 £87,500 £92,500
UK median annual salary £52,500 £50,000 £57,500
% change year-on-year +5.00% -13.04% +4.55%

Google
Trend for Jobs with a WFH Option

Job vacancies with remote working options citing Google as a proportion of all IT jobs advertised.
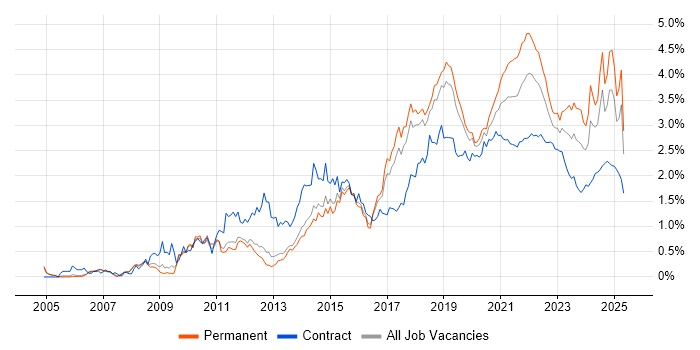
Google trend for jobs with Hybrid/Remote/WFH options

Google
Salary Trend for Jobs with a WFH Option

3-month moving average salary quoted in job vacancies with remote working options citing Google.

Google salary trend for jobs with a WFH option

Google
Salary Histogram for Jobs with a WFH Option

Salary distribution for jobs with remote working options citing Google over the 6 months to 19 June 2025.

Google salary histogram for jobs with a WFH option

Google
Co-occurring Skills and Capabilities with WFH Options by Category

The follow tables expand on the table above by listing co-occurrences grouped by category. The same employment type, locality and period is covered with up to 20 co-occurrences shown in each of the following categories:

Application Platforms
1 52 (4.11%) CMS
2 40 (3.16%) WordPress
3 24 (1.90%) Apache Spark
4 21 (1.66%) Confluence
5 11 (0.87%) Drupal
6 10 (0.79%) Microsoft Exchange
7 5 (0.40%) Apache
8 4 (0.32%) Umbraco
9 3 (0.24%) IBM Domino
9 3 (0.24%) OpenStack
10 2 (0.16%) Apache Airflow
10 2 (0.16%) SharePoint
10 2 (0.16%) Tomcat
10 2 (0.16%) WebSphere
10 2 (0.16%) WebSphere Application Server
11 1 (0.079%) Apache Solr
11 1 (0.079%) Ethereum
11 1 (0.079%) nginx
11 1 (0.079%) Sitecore CMS
Applications
1 43 (3.40%) Microsoft Excel
2 34 (2.69%) Microsoft Office
3 22 (1.74%) Photoshop
4 10 (0.79%) Adobe Premiere
5 9 (0.71%) Adobe XD
6 4 (0.32%) Microsoft PowerPoint
6 4 (0.32%) Microsoft Project
6 4 (0.32%) Notion
6 4 (0.32%) Spreadsheet
6 4 (0.32%) Trello
7 3 (0.24%) Acrobat
7 3 (0.24%) Adobe Illustrator
7 3 (0.24%) Chatbot
8 2 (0.16%) Sketch
Business Applications
1 12 (0.95%) Shopify
2 7 (0.55%) Dynamics CRM
3 6 (0.47%) NetSuite
4 4 (0.32%) Magento
4 4 (0.32%) Payment Gateway
4 4 (0.32%) Salesforce CRM
5 2 (0.16%) Dynamics GP
6 1 (0.079%) Raiser’s Edge
Cloud Services
1 350 (27.69%) AWS
2 226 (17.88%) Pulumi
3 193 (15.27%) GCP
4 155 (12.26%) Google Analytics
5 147 (11.63%) Azure
6 66 (5.22%) Google Ads
7 46 (3.64%) Power Platform
8 39 (3.09%) Google Workspace
9 33 (2.61%) SaaS
10 29 (2.29%) Google Sheets
11 27 (2.14%) Google Tag Manager
12 23 (1.82%) Microsoft 365
13 21 (1.66%) Canva
14 20 (1.58%) Cloud Computing
15 18 (1.42%) GitHub
15 18 (1.42%) Google Docs
15 18 (1.42%) Snowflake
16 17 (1.34%) Microsoft Advertising
17 15 (1.19%) Google Data Studio
18 14 (1.11%) dbt
Communications & Networking
1 216 (17.09%) Broadband
2 17 (1.34%) TCP/IP
3 16 (1.27%) HTTP
4 12 (0.95%) Firewall
5 10 (0.79%) DNS
6 9 (0.71%) DHCP
6 9 (0.71%) VPN
7 8 (0.63%) SAN
8 7 (0.55%) NAS
9 6 (0.47%) WAN
10 5 (0.40%) Intranet
10 5 (0.40%) LAN
10 5 (0.40%) VSAN
10 5 (0.40%) Wi-Fi
10 5 (0.40%) Wireless
11 3 (0.24%) Internet
11 3 (0.24%) VoIP
12 2 (0.16%) FCoE
12 2 (0.16%) Fibre Channel
12 2 (0.16%) iSCSI
Database & Business Intelligence
1 241 (19.07%) NoSQL
2 220 (17.41%) Relational Database
3 215 (17.01%) RDBMS
4 46 (3.64%) Power BI
5 35 (2.77%) BigQuery
6 26 (2.06%) Tableau
7 25 (1.98%) Data Warehouse
8 24 (1.90%) PostgreSQL
9 22 (1.74%) Looker
10 14 (1.11%) Data Lake
11 13 (1.03%) MongoDB
11 13 (1.03%) MySQL
11 13 (1.03%) Redis
12 12 (0.95%) Big Data
12 12 (0.95%) Hadoop
13 11 (0.87%) Amazon RDS
13 11 (0.87%) Data Hub
13 11 (0.87%) Elasticsearch
13 11 (0.87%) SQL Server
14 9 (0.71%) Amazon Redshift
Development Applications
1 215 (17.01%) Jaeger
2 30 (2.37%) Git
2 30 (2.37%) JIRA
3 16 (1.27%) Jenkins
4 9 (0.71%) SonarQube
5 6 (0.47%) Gradle
5 6 (0.47%) Maven
6 5 (0.40%) Bazaar
6 5 (0.40%) Oracle Forms
6 5 (0.40%) webpack
7 4 (0.32%) Axure RP
7 4 (0.32%) Balsamiq
7 4 (0.32%) Visual Studio
8 3 (0.24%) GitLab
9 2 (0.16%) Crashlytics
9 2 (0.16%) fastlane
9 2 (0.16%) JUnit
9 2 (0.16%) Sonatype Nexus
9 2 (0.16%) SQL Server Management Studio (SSMS)
9 2 (0.16%) Subversion
General
1 611 (48.34%) Retail
2 542 (42.88%) Manufacturing
3 273 (21.60%) Inclusion and Diversity
4 219 (17.33%) Social Skills
5 199 (15.74%) Dutch Language
6 198 (15.66%) Finnish Language
7 163 (12.90%) Marketing
8 162 (12.82%) Analytical Skills
9 135 (10.68%) Finance
10 69 (5.46%) Banking
11 66 (5.22%) Advertising
12 49 (3.88%) Catalan Language
13 31 (2.45%) Games
14 27 (2.14%) Public Sector
15 22 (1.74%) Organisational Skills
16 16 (1.27%) Presentation Skills
17 14 (1.11%) Legal
18 13 (1.03%) Law
19 12 (0.95%) Brand Awareness
19 12 (0.95%) Police
Job Titles
1 542 (42.88%) Trainer
2 260 (20.57%) Lead
3 215 (17.01%) Team Leader
4 100 (7.91%) Senior
5 50 (3.96%) Architect
6 41 (3.24%) Software Engineer
7 37 (2.93%) Analyst
8 35 (2.77%) Developer
9 33 (2.61%) Solutions Architect
10 21 (1.66%) Senior Architect
10 21 (1.66%) Senior Software Engineer
11 19 (1.50%) AWS Architect
11 19 (1.50%) AWS Solution Architect
11 19 (1.50%) Senior Solutions Architect
12 17 (1.34%) GCP Engineer
13 16 (1.27%) IT Support
14 15 (1.19%) Data Engineer
14 15 (1.19%) TOGAF Architect
15 14 (1.11%) Marketing Manager
15 14 (1.11%) PPC Executive
Libraries, Frameworks & Software Standards
1 221 (17.48%) Elastic Stack
2 215 (17.01%) OpenTelemetry
3 48 (3.80%) HTML
4 33 (2.61%) Kafka
5 29 (2.29%) CSS
6 23 (1.82%) REST
7 21 (1.66%) Spring
8 18 (1.42%) React
9 17 (1.34%) Node.js
10 15 (1.19%) RESTful
11 14 (1.11%) FastAPI
11 14 (1.11%) Flask
12 13 (1.03%) Django
12 13 (1.03%) RabbitMQ
13 11 (0.87%) Spring Boot
14 9 (0.71%) .NET
14 9 (0.71%) HTML5
14 9 (0.71%) JSON
14 9 (0.71%) Middleware
15 5 (0.40%) CSS3
Miscellaneous
1 539 (42.64%) Robotics
2 80 (6.33%) Social Media
3 41 (3.24%) Management Information System
4 33 (2.61%) Cloud Native
5 31 (2.45%) Blog
6 30 (2.37%) Distributed Systems
7 29 (2.29%) Product Ownership
8 28 (2.22%) Algorithms
9 16 (1.27%) Self-Motivation
10 15 (1.19%) Onboarding
11 11 (0.87%) Public Cloud
12 10 (0.79%) Legacy Systems
13 9 (0.71%) Analytical Mindset
13 9 (0.71%) Digital Media
13 9 (0.71%) Driving Licence
13 9 (0.71%) Marketing Technology
14 8 (0.63%) Mobile App
14 8 (0.63%) Mobile Games
14 8 (0.63%) Private Cloud
15 7 (0.55%) Photography
Operating Systems
1 238 (18.83%) Linux
2 226 (17.88%) Unix
3 23 (1.82%) Windows
4 11 (0.87%) Android
4 11 (0.87%) Windows 10
5 9 (0.71%) Apple iOS
6 5 (0.40%) Windows Server
7 3 (0.24%) Mac OS
8 2 (0.16%) Solaris
8 2 (0.16%) Windows 7
9 1 (0.079%) Mac OS X
9 1 (0.079%) Windows Server 2008
9 1 (0.079%) Windows Server 2012
9 1 (0.079%) Windows Server 2016
9 1 (0.079%) Windows Server 2019
Processes & Methodologies
1 687 (54.35%) Problem-Solving
2 595 (47.07%) Artificial Intelligence
3 574 (45.41%) Data Privacy
4 571 (45.17%) Machine Learning
5 550 (43.51%) LLM
6 548 (43.35%) Generative AI
7 539 (42.64%) Red Team
8 362 (28.64%) Agile
9 297 (23.50%) Roadmaps
10 295 (23.34%) DevOps
11 276 (21.84%) Mentoring
12 259 (20.49%) Containerisation
13 244 (19.30%) Performance Optimisation
14 234 (18.51%) Continuous Integration
15 230 (18.20%) High Availability
16 229 (18.12%) Infrastructure as Code
17 224 (17.72%) Task Automation
18 222 (17.56%) Resource Management
19 221 (17.48%) Cost Optimisation
20 220 (17.41%) Product Management
Programming Languages
1 314 (24.84%) Python
2 278 (21.99%) Java
3 245 (19.38%) JavaScript
4 224 (17.72%) Go
5 218 (17.25%) Bash
6 97 (7.67%) SQL
7 24 (1.90%) C#
8 17 (1.34%) Scala
9 8 (0.63%) PHP
10 5 (0.40%) Data Analysis Expressions
10 5 (0.40%) PowerShell
10 5 (0.40%) T-SQL
10 5 (0.40%) TypeScript
11 4 (0.32%) Kotlin
11 4 (0.32%) PL/SQL
11 4 (0.32%) VBA
12 3 (0.24%) R
12 3 (0.24%) Swift
13 2 (0.16%) Ruby
13 2 (0.16%) Rust
Qualifications
1 620 (49.05%) Degree
2 233 (18.43%) AWS Certification
3 25 (1.98%) Computer Science Degree
4 22 (1.74%) Azure Certification
5 20 (1.58%) SC Cleared
5 20 (1.58%) Security Cleared
6 19 (1.50%) DBS Check
7 15 (1.19%) AWS Certified Solutions Architect
8 13 (1.03%) Microsoft Certification
9 12 (0.95%) Master's Degree
10 9 (0.71%) PMI Certification
11 7 (0.55%) BPSS Clearance
12 6 (0.47%) ITIL Certification
13 5 (0.40%) PMP
13 5 (0.40%) VMware Certified Professional (VCP)
14 4 (0.32%) SAP Certification
14 4 (0.32%) TOGAF Certification
15 1 (0.079%) CISSP
15 1 (0.079%) ISTQB Foundation Certification
15 1 (0.079%) OSCP
Quality Assurance & Compliance
1 32 (2.53%) GDPR
2 29 (2.29%) Accessibility
3 19 (1.50%) Data Quality
4 13 (1.03%) HIPAA
4 13 (1.03%) QA
5 12 (0.95%) NIST
6 11 (0.87%) ISO/IEC 27001
7 9 (0.71%) WCAG
8 8 (0.63%) Cyber Essentials
9 5 (0.40%) Actionable Recommendations
10 3 (0.24%) PCI DSS
10 3 (0.24%) PERC
10 3 (0.24%) SLA
11 2 (0.16%) IEC 62304
11 2 (0.16%) ISO 13485
12 1 (0.079%) GRC
12 1 (0.079%) SOC 2
System Software
1 295 (23.34%) Docker
2 8 (0.63%) Active Directory
3 5 (0.40%) Hyper-V
3 5 (0.40%) VMware NSX
4 4 (0.32%) HDFS
5 3 (0.24%) VMware Infrastructure
6 2 (0.16%) KVM
6 2 (0.16%) NFS
6 2 (0.16%) SRDF
6 2 (0.16%) Veritas Cluster Server
6 2 (0.16%) Xen
7 1 (0.079%) Varnish
Systems Management
1 295 (23.34%) Kubernetes
2 266 (21.04%) Terraform
3 221 (17.48%) Prometheus
4 219 (17.33%) Ansible
4 219 (17.33%) Argo
5 215 (17.01%) Kustomize
6 11 (0.87%) AWS Copilot
7 5 (0.40%) Progress Chef
8 4 (0.32%) Grafana
9 3 (0.24%) Active Directory Federation Services
10 2 (0.16%) Jamf Pro
10 2 (0.16%) Microsoft Intune
10 2 (0.16%) Puppet
11 1 (0.079%) AppManager
11 1 (0.079%) FortiGate
11 1 (0.079%) Istio
11 1 (0.079%) Matomo
11 1 (0.079%) Single Sign-On
Vendors
1 585 (46.28%) Adobe
2 556 (43.99%) Databricks
3 149 (11.79%) Microsoft
4 31 (2.45%) Salesforce
5 29 (2.29%) Apple
6 28 (2.22%) TikTok
7 25 (1.98%) Facebook
8 23 (1.82%) Ahrefs
9 19 (1.50%) Instagram
10 16 (1.27%) Oracle
10 16 (1.27%) YouTube
11 15 (1.19%) Hotjar
11 15 (1.19%) Screaming Frog
12 13 (1.03%) HubSpot
12 13 (1.03%) Pinterest
12 13 (1.03%) SAP
13 10 (0.79%) VMware
14 9 (0.71%) Twitter
15 8 (0.63%) Teradata
16 7 (0.55%) WooCommerce