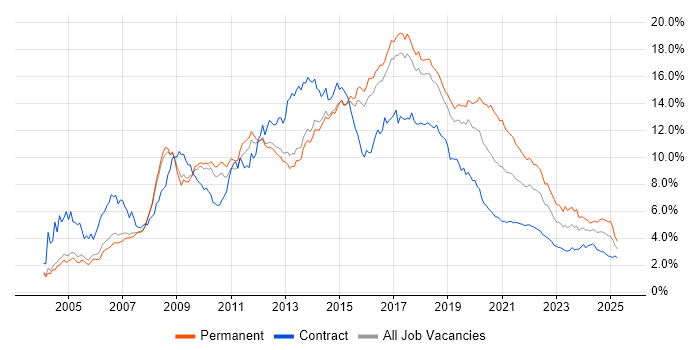
HTML Jobs with Hybrid/Remote/WFH Options

HTML (including XHTML, DHTML & HTML5)
UK > Work from Home

The table below provides summary statistics for permanent remote or hybrid work requiring HTML skills. It includes a benchmarking guide to the annual salaries offered in vacancies that cited HTML over the 6 months leading up to 12 July 2025, comparing them to the same period in the previous two years.

6 months to
12 Jul 2025
Same period 2024 Same period 2023
Rank 71 47 46
Rank change year-on-year -24 -1 -20
Permanent jobs citing HTML 938 1,637 2,217
As % of all permanent jobs with a WFH option 4.46% 4.97% 6.32%
As % of the Libraries, Frameworks & Software Standards category 18.29% 19.05% 19.52%
Number of salaries quoted 542 1,355 1,761
10th Percentile £35,125 £31,250 £36,250
25th Percentile £46,250 £39,500 £45,000
Median annual salary (50th Percentile) £65,000 £52,500 £55,000
Median % change year-on-year +23.81% -4.55% -
75th Percentile £73,698 £65,000 £74,111
90th Percentile £83,750 £78,750 £88,750
UK median annual salary £60,000 £52,500 £55,000
% change year-on-year +14.29% -4.55% -

All Software Libraries and Frameworks
Work from Home

HTML falls under the Software Libraries and Frameworks category. For comparison with the information above, the following table provides summary statistics for all permanent job vacancies with remote or hybrid options requiring technical specification, industry standards, software libraries and framework skills.

Permanent vacancies with a requirement for technical specification, industry standards, software libraries and framework skills 5,129 8,595 11,355
As % of all permanent jobs with a WFH option 24.38% 26.08% 32.38%
Number of salaries quoted 2,957 6,966 9,118
10th Percentile £37,500 £38,750 £41,250
25th Percentile £50,000 £47,500 £51,104
Median annual salary (50th Percentile) £66,219 £60,000 £65,066
Median % change year-on-year +10.37% -7.79% +4.10%
75th Percentile £85,000 £82,500 £85,000
90th Percentile £115,000 £111,875 £105,000
UK median annual salary £67,500 £60,000 £66,375
% change year-on-year +12.50% -9.60% +2.12%

HTML
Trend for Jobs with a WFH Option

Job vacancies with remote working options citing HTML as a proportion of all IT jobs advertised.

HTML trend for jobs with Hybrid/Remote/WFH options

HTML
Salary Trend for Jobs with a WFH Option

3-month moving average salary quoted in job vacancies with remote working options citing HTML.

HTML salary trend for jobs with a WFH option

HTML
Salary Histogram for Jobs with a WFH Option

Salary distribution for jobs with remote working options citing HTML over the 6 months to 12 July 2025.

HTML salary histogram for jobs with a WFH option

HTML
Co-occurring Skills and Capabilities with WFH Options by Category

The follow tables expand on the table above by listing co-occurrences grouped by category. The same employment type, locality and period is covered with up to 20 co-occurrences shown in each of the following categories:

Application Platforms
1 165 (17.59%) Confluence
2 54 (5.76%) CMS
3 38 (4.05%) WordPress
4 15 (1.60%) IIS
5 13 (1.39%) SharePoint
6 12 (1.28%) Drupal
7 10 (1.07%) Headless CMS
8 8 (0.85%) Umbraco
9 3 (0.32%) nginx
10 2 (0.21%) Apache
10 2 (0.21%) NServiceBus
10 2 (0.21%) OpenEdge
11 1 (0.11%) Apache Airflow
11 1 (0.11%) Apache Spark
11 1 (0.11%) Appian
11 1 (0.11%) ColdFusion
11 1 (0.11%) Mendix
11 1 (0.11%) Strapi
Applications
1 100 (10.66%) Chatbot
2 24 (2.56%) Photoshop
3 16 (1.71%) Adobe Illustrator
3 16 (1.71%) Adobe XD
4 12 (1.28%) Adobe Creative Suite
5 9 (0.96%) Adobe Premiere
6 7 (0.75%) Microsoft Excel
6 7 (0.75%) Microsoft Office
7 5 (0.53%) InDesign
7 5 (0.53%) Sketch
8 3 (0.32%) Microsoft PowerPoint
8 3 (0.32%) MS Visio
9 2 (0.21%) Elementor
9 2 (0.21%) InVision
9 2 (0.21%) Spreadsheet
10 1 (0.11%) Trello
Business Applications
1 24 (2.56%) Shopify
2 20 (2.13%) NetSuite
3 18 (1.92%) Dynamics CRM
4 15 (1.60%) Magento
5 11 (1.17%) JDE OneWorld
6 7 (0.75%) Sage 200
6 7 (0.75%) Sage 50
7 4 (0.43%) Sage 1000
8 2 (0.21%) Elite 3E
8 2 (0.21%) Odoo
9 1 (0.11%) Adobe Campaign
9 1 (0.11%) CiviCRM
9 1 (0.11%) Remedy ITSM
9 1 (0.11%) Salesforce CRM
Cloud Services
1 389 (41.47%) Azure
2 323 (34.43%) AWS
3 170 (18.12%) GCP
4 43 (4.58%) Azure DevOps
5 40 (4.26%) SaaS
6 38 (4.05%) Google Analytics
7 34 (3.62%) Serverless
8 33 (3.52%) Azure Service Bus
9 30 (3.20%) GitHub
9 30 (3.20%) Power Platform
10 27 (2.88%) Power Automate
11 26 (2.77%) Figma
12 23 (2.45%) Azure Cosmos DB
12 23 (2.45%) PowerApps
13 21 (2.24%) SonarCloud
14 20 (2.13%) Boomi
15 18 (1.92%) Azure Logic Apps
16 17 (1.81%) Dynamics 365
17 16 (1.71%) AWS Lambda
17 16 (1.71%) Cloudflare
Communications & Networking
1 5 (0.53%) HTTP
2 3 (0.32%) TCP/IP
3 2 (0.21%) DNS
3 2 (0.21%) FTP
3 2 (0.21%) Internet
3 2 (0.21%) SSL
4 1 (0.11%) Broadband
4 1 (0.11%) DHCP
4 1 (0.11%) Ethernet
4 1 (0.11%) SMTP
4 1 (0.11%) VPN
Database & Business Intelligence
1 315 (33.58%) SQL Server
2 65 (6.93%) MySQL
3 38 (4.05%) Elasticsearch
4 31 (3.30%) MongoDB
5 25 (2.67%) Relational Database
6 22 (2.35%) Redis
7 20 (2.13%) NoSQL
8 18 (1.92%) Azure SQL Database
9 17 (1.81%) PostgreSQL
10 16 (1.71%) Power BI
11 12 (1.28%) SQL Server Reporting Services
12 10 (1.07%) OLTP
13 7 (0.75%) NonStop SQL
13 7 (0.75%) SQL Server Integration Services
14 4 (0.43%) BigQuery
14 4 (0.43%) Hazelcast
15 3 (0.32%) MariaDB
15 3 (0.32%) Metadata
16 2 (0.21%) Big Data
16 2 (0.21%) Oracle Database
Development Applications
1 280 (29.85%) JIRA
2 258 (27.51%) Selenium
3 253 (26.97%) SonarQube
4 252 (26.87%) Bitbucket
5 250 (26.65%) GitLab
6 249 (26.55%) Maven
7 247 (26.33%) Cucumber
7 247 (26.33%) Sonatype Nexus
8 156 (16.63%) Git
9 40 (4.26%) Visual Studio
10 29 (3.09%) Team Foundation Server
11 22 (2.35%) Octopus Deploy
12 21 (2.24%) MSBuild
13 18 (1.92%) webpack
14 16 (1.71%) Cypress.io
14 16 (1.71%) Jasmine
14 16 (1.71%) Jenkins
15 13 (1.39%) TeamCity
16 12 (1.28%) NUnit
17 9 (0.96%) Subversion
General
1 351 (37.42%) Finance
2 272 (29.00%) Inclusion and Diversity
3 256 (27.29%) Banking
4 140 (14.93%) Retail
5 138 (14.71%) Social Skills
6 91 (9.70%) Investment Banking
7 90 (9.59%) Corporate Banking
8 62 (6.61%) Marketing
9 40 (4.26%) Analytical Skills
9 40 (4.26%) Law
10 26 (2.77%) Games
11 19 (2.03%) Public Sector
12 14 (1.49%) Manufacturing
13 11 (1.17%) Legal
14 10 (1.07%) Back Office
14 10 (1.07%) Front Office
14 10 (1.07%) iGaming
15 9 (0.96%) Advertising
16 8 (0.85%) Organisational Skills
17 6 (0.64%) Presentation Skills
Job Titles
1 385 (41.04%) Developer
2 308 (32.84%) Software Engineer
3 117 (12.47%) Senior
4 95 (10.13%) Trainer
5 79 (8.42%) Senior Developer
6 73 (7.78%) Full-Stack Developer
7 59 (6.29%) Front-End Developer (Client-Side Developer)
8 58 (6.18%) .NET Developer
9 42 (4.48%) PHP Developer
10 33 (3.52%) Architect
11 30 (3.20%) Lead
12 28 (2.99%) Designer
13 27 (2.88%) C# Developer
13 27 (2.88%) Software Developer
14 24 (2.56%) Consultant
14 24 (2.56%) Senior Full-Stack Developer
14 24 (2.56%) Technical Architect
15 23 (2.45%) Front-End Engineer (Client-Side Engineer)
16 21 (2.24%) Web Developer
17 20 (2.13%) Lead Developer
Libraries, Frameworks & Software Standards
1 678 (72.28%) CSS
2 407 (43.39%) React
3 257 (27.40%) Redux
3 257 (27.40%) Spring
4 253 (26.97%) Spring Boot
5 252 (26.87%) Kafka
6 249 (26.55%) JPA
7 210 (22.39%) HTML5
8 186 (19.83%) RESTful
9 173 (18.44%) CSS3
10 171 (18.23%) Hibernate
11 167 (17.80%) REST
12 166 (17.70%) .NET
13 129 (13.75%) Jest
14 123 (13.11%) Sass
15 109 (11.62%) AngularJS
16 89 (9.49%) JSON
17 81 (8.64%) ASP.NET
18 73 (7.78%) XML
19 64 (6.82%) .NET Core
Miscellaneous
1 262 (27.93%) Product Ownership
2 261 (27.83%) Enterprise Software
3 17 (1.81%) Cloud Native
3 17 (1.81%) Social Media
4 16 (1.71%) Virtual Team
5 12 (1.28%) Mobile App
5 12 (1.28%) Self-Motivation
6 10 (1.07%) Legacy Systems
7 9 (0.96%) Management Information System
8 8 (0.85%) Algorithms
8 8 (0.85%) Distributed Systems
8 8 (0.85%) EPoS
8 8 (0.85%) Mobile Games
8 8 (0.85%) Onboarding
9 7 (0.75%) Client/Server
9 7 (0.75%) Equities
10 6 (0.64%) Animation
10 6 (0.64%) Blog
10 6 (0.64%) Graphic Design
10 6 (0.64%) Hedge funds
Operating Systems
1 20 (2.13%) Linux
1 20 (2.13%) Windows
2 8 (0.85%) Windows Server
3 6 (0.64%) Android
4 5 (0.53%) Apple iOS
5 3 (0.32%) Ubuntu
5 3 (0.32%) Unix
6 1 (0.11%) CentOS
6 1 (0.11%) Debian
Processes & Methodologies
1 442 (47.12%) Agile
2 377 (40.19%) Full-Stack Development
3 362 (38.59%) Front End Development
4 353 (37.63%) Software Engineering
5 335 (35.71%) DevOps
6 330 (35.18%) Microservices
7 308 (32.84%) Test Automation
8 300 (31.98%) Performance Optimisation
9 295 (31.45%) CI/CD
10 278 (29.64%) SDLC
11 262 (27.93%) Containerisation
12 210 (22.39%) User Experience
13 197 (21.00%) Continuous Improvement
14 195 (20.79%) TDD
15 186 (19.83%) Clean Code
16 173 (18.44%) Artificial Intelligence
17 139 (14.82%) Problem-Solving
18 135 (14.39%) Mentoring
19 129 (13.75%) Code Quality
20 122 (13.01%) Responsive Web Design
Programming Languages
1 824 (87.85%) JavaScript
2 582 (62.05%) SQL
3 335 (35.71%) Java
4 331 (35.29%) C#
5 257 (27.40%) TypeScript
6 195 (20.79%) Python
7 158 (16.84%) C++
8 138 (14.71%) PHP
9 61 (6.50%) C
10 54 (5.76%) Ruby
11 52 (5.54%) R
12 50 (5.33%) MATLAB
13 49 (5.22%) Dart
13 49 (5.22%) Rust
14 20 (2.13%) T-SQL
15 12 (1.28%) PL/SQL
16 11 (1.17%) Delphi
16 11 (1.17%) PowerShell
17 8 (0.85%) VBA
18 7 (0.75%) VB.NET
Qualifications
1 238 (25.37%) Degree
2 86 (9.17%) Computer Science Degree
3 20 (2.13%) Security Cleared
4 14 (1.49%) SC Cleared
5 5 (0.53%) ISTQB
6 4 (0.43%) DBS Check
7 3 (0.32%) BPSS Clearance
7 3 (0.32%) Microsoft Certification
8 2 (0.21%) AWS Certification
8 2 (0.21%) Azure Certification
8 2 (0.21%) CISSP
8 2 (0.21%) ISTQB Advanced Certification
8 2 (0.21%) Master's Degree
8 2 (0.21%) TOGAF Certification
9 1 (0.11%) (ISC)2 CCSP
9 1 (0.11%) AWS Certified Solutions Architect
9 1 (0.11%) Cisco Certification
9 1 (0.11%) CISM
9 1 (0.11%) CompTIA Security+
9 1 (0.11%) ISTQB Foundation Certification
Quality Assurance & Compliance
1 284 (30.28%) QA
2 156 (16.63%) Accessibility
3 35 (3.73%) GDPR
4 14 (1.49%) WCAG
5 4 (0.43%) Actionable Recommendations
6 3 (0.32%) ISO/IEC 27001
6 3 (0.32%) SLA
7 2 (0.21%) Data Quality
7 2 (0.21%) ISO 9001
8 1 (0.11%) ISO 13485
8 1 (0.11%) MiFID
System Software
1 307 (32.73%) Docker
2 1 (0.11%) Active Directory
2 1 (0.11%) Hyper-V
2 1 (0.11%) VMware Infrastructure
Systems Management
1 262 (27.93%) Kubernetes
2 10 (1.07%) Single Sign-On
3 9 (0.96%) Terraform
4 1 (0.11%) HP Quality Center
4 1 (0.11%) HP UCMDB
4 1 (0.11%) Matomo
Vendors
1 247 (26.33%) Solace
2 106 (11.30%) Microsoft
3 99 (10.55%) PayPal
4 50 (5.33%) Google
5 41 (4.37%) Adobe
6 24 (2.56%) Salesforce
7 20 (2.13%) ServiceNow
8 13 (1.39%) Oracle
9 11 (1.17%) Apple
9 11 (1.17%) Dell
9 11 (1.17%) Sage
10 10 (1.07%) Rollbar
11 9 (0.96%) MuleSoft
11 9 (0.96%) Twitter
11 9 (0.96%) YouTube
12 6 (0.64%) Ahrefs
12 6 (0.64%) Guidewire
13 5 (0.53%) Facebook
13 5 (0.53%) HubSpot
13 5 (0.53%) WooCommerce