Stakeholder Engagement Jobs in the City of London

Stakeholder Engagement
Central London > City of London

The table below provides summary statistics for permanent job vacancies advertised in the City of London requiring Stakeholder Engagement skills. It includes a benchmarking guide to the annual salaries offered in vacancies that cited Stakeholder Engagement over the 6 months leading up to 11 May 2025, comparing them to the same period in the previous two years.

6 months to
11 May 2025
Same period 2024 Same period 2023
Rank 114 126 170
Rank change year-on-year +12 +44 +13
Permanent jobs citing Stakeholder Engagement 34 54 54
As % of all permanent jobs advertised in the City of London 1.64% 1.61% 1.17%
As % of the Processes & Methodologies category 1.71% 1.75% 1.22%
Number of salaries quoted 28 28 36
10th Percentile £64,250 £47,000 £51,250
25th Percentile £74,063 £67,188 £52,500
Median annual salary (50th Percentile) £85,500 £75,000 £67,500
Median % change year-on-year +14.00% +11.11% -1.82%
75th Percentile £93,688 £87,500 £83,750
90th Percentile £130,875 £101,625 £96,250
Central London median annual salary £85,500 £75,000 £65,173
% change year-on-year +14.00% +15.08% -8.21%

All Process and Methodology Skills
City of London

Stakeholder Engagement falls under the Processes and Methodologies category. For comparison with the information above, the following table provides summary statistics for all permanent job vacancies requiring process or methodology skills in the City of London.

Permanent vacancies with a requirement for process or methodology skills 1,984 3,092 4,410
As % of all permanent jobs advertised in the City of London 95.94% 92.08% 95.27%
Number of salaries quoted 1,502 2,446 3,687
10th Percentile £42,500 £41,250 £43,750
25th Percentile £53,750 £55,000 £56,250
Median annual salary (50th Percentile) £75,000 £75,000 £75,000
Median % change year-on-year - - +3.45%
75th Percentile £97,500 £95,000 £97,500
90th Percentile £122,500 £112,500 £112,500
Central London median annual salary £75,000 £72,500 £75,000
% change year-on-year +3.45% -3.33% +3.45%

Stakeholder Engagement
Job Vacancy Trend in the City of London

Job postings citing Stakeholder Engagement as a proportion of all IT jobs advertised in the City of London.
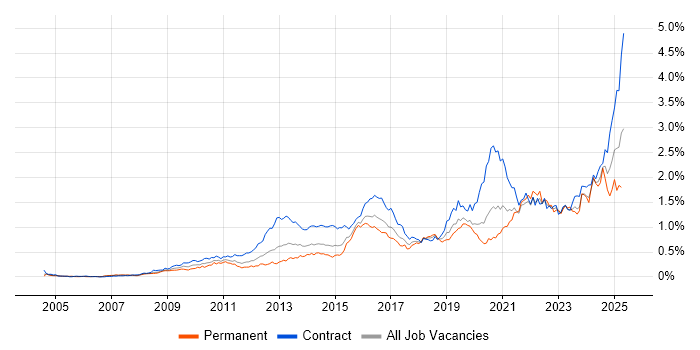
Job vacancy trend for Stakeholder Engagement in the City of London

Stakeholder Engagement
Salary Trend in the City of London

3-month moving average salary quoted in jobs citing Stakeholder Engagement in the City of London.

Salary trend for Stakeholder Engagement in the City of London

Stakeholder Engagement
Salary Histogram in the City of London

Salary distribution for jobs citing Stakeholder Engagement in the City of London over the 6 months to 11 May 2025.

Salary histogram for Stakeholder Engagement in the City of London

Stakeholder Engagement
Co-occurring Skills and Capabilities in the City of London by Category

The follow tables expand on the table above by listing co-occurrences grouped by category. The same employment type, locality and period is covered with up to 20 co-occurrences shown in each of the following categories:

Application Platforms
1 7 (20.59%) SharePoint
2 1 (2.94%) Confluence
Applications
1 3 (8.82%) Microsoft Office
2 1 (2.94%) Adobe Creative Suite
2 1 (2.94%) MS Visio
Business Applications
1 8 (23.53%) Dynamics CRM
2 1 (2.94%) Elite 3E
2 1 (2.94%) NetSuite
Cloud Services
1 10 (29.41%) Azure
1 10 (29.41%) Power Platform
2 8 (23.53%) Dynamics 365
2 8 (23.53%) Microsoft 365
3 7 (20.59%) Azure Data Factory
3 7 (20.59%) PowerApps
4 6 (17.65%) Azure DevOps
5 1 (2.94%) AWS
5 1 (2.94%) Canva
5 1 (2.94%) dbt
5 1 (2.94%) Google Analytics
5 1 (2.94%) Power Automate
5 1 (2.94%) SaaS
Communications & Networking
1 1 (2.94%) DHCP
1 1 (2.94%) DNS
1 1 (2.94%) Firewall
1 1 (2.94%) LAN
1 1 (2.94%) Network Security
1 1 (2.94%) Remote Desktop
1 1 (2.94%) SMS
1 1 (2.94%) VLAN
1 1 (2.94%) VPN
1 1 (2.94%) WAN
1 1 (2.94%) Wireless
Database & Business Intelligence
1 3 (8.82%) SQL Server
2 2 (5.88%) Power BI
3 1 (2.94%) Amazon Redshift
3 1 (2.94%) BigQuery
3 1 (2.94%) Data Lake
3 1 (2.94%) Data Warehouse
3 1 (2.94%) Looker
3 1 (2.94%) Mixpanel
3 1 (2.94%) Snowflake Schema
3 1 (2.94%) SQL Server Reporting Services
Development Applications
1 4 (11.76%) JIRA
2 1 (2.94%) Eclipse
General
1 19 (55.88%) Finance
1 19 (55.88%) Social Skills
2 13 (38.24%) Analytical Skills
3 9 (26.47%) Marketing
4 5 (14.71%) Legal
5 3 (8.82%) Inclusion and Diversity
5 3 (8.82%) Retail
6 1 (2.94%) Documentation Skills
6 1 (2.94%) Front Office
6 1 (2.94%) Games
6 1 (2.94%) Law
Job Titles
1 6 (17.65%) Platform Specialist
1 6 (17.65%) Power Platform Specialist
2 5 (14.71%) Dynamics 365 Specialist
3 4 (11.76%) Head of Delivery
4 3 (8.82%) Analyst
5 2 (5.88%) Head of Architecture
5 2 (5.88%) IAM Specialist
5 2 (5.88%) Lead
5 2 (5.88%) Product Analyst
5 2 (5.88%) Security Manager
5 2 (5.88%) Senior
5 2 (5.88%) Service Desk Manager
5 2 (5.88%) Service Manager
6 1 (2.94%) Agile Delivery Lead
6 1 (2.94%) Data Analytics Director
6 1 (2.94%) Dynamics 365 Architect
6 1 (2.94%) Dynamics 365 Solution Architect
6 1 (2.94%) Identity Management Specialist
6 1 (2.94%) Sales Solutions Architect
6 1 (2.94%) Vulnerability Manager
Libraries, Frameworks & Software Standards
1 1 (2.94%) .NET
Miscellaneous
1 9 (26.47%) Analytical Mindset
2 6 (17.65%) Data Structures
3 4 (11.76%) Product Ownership
4 3 (8.82%) Management Information System
5 2 (5.88%) Enterprise Software
5 2 (5.88%) Onboarding
5 2 (5.88%) Self-Motivation
5 2 (5.88%) Tandem
5 2 (5.88%) Virtual Team
6 1 (2.94%) Cyber Threat
6 1 (2.94%) Derivative
6 1 (2.94%) Fixed Income
6 1 (2.94%) Greenfield Project
6 1 (2.94%) Industrial Internet of Things
6 1 (2.94%) Interest Rate Derivative
6 1 (2.94%) Security Posture
6 1 (2.94%) Social Media
6 1 (2.94%) Swaptions
Operating Systems
1 1 (2.94%) Windows
1 1 (2.94%) Windows Server
Processes & Methodologies
1 16 (47.06%) Problem-Solving
2 10 (29.41%) Continuous Improvement
3 9 (26.47%) CRM
4 8 (23.53%) DevOps
4 8 (23.53%) Project Delivery
4 8 (23.53%) Project Management
4 8 (23.53%) Roadmaps
5 7 (20.59%) Data Protection
5 7 (20.59%) Stakeholder Management
5 7 (20.59%) User Experience
6 6 (17.65%) Agile
6 6 (17.65%) CI/CD
7 5 (14.71%) Decision-Making
7 5 (14.71%) Service Delivery
7 5 (14.71%) Strategic Thinking
8 4 (11.76%) Change Management
8 4 (11.76%) ITIL
8 4 (11.76%) Process Improvement
8 4 (11.76%) Resource Allocation
8 4 (11.76%) Risk Management
Programming Languages
1 7 (20.59%) C#
1 7 (20.59%) JavaScript
2 2 (5.88%) Python
3 1 (2.94%) C++
3 1 (2.94%) SQL
Qualifications
1 11 (32.35%) Degree
2 6 (17.65%) Microsoft Certification
3 3 (8.82%) CISSP
4 2 (5.88%) CISM
4 2 (5.88%) CRISC
4 2 (5.88%) DBS Check
4 2 (5.88%) ITIL Certification
4 2 (5.88%) Security Cleared
5 1 (2.94%) APMG
5 1 (2.94%) CISA
5 1 (2.94%) ISO 27001 Lead Auditor
5 1 (2.94%) SC Cleared
5 1 (2.94%) TOGAF Certification
Quality Assurance & Compliance
1 2 (5.88%) Accessibility
1 2 (5.88%) GRC
1 2 (5.88%) ISO/IEC 27001
1 2 (5.88%) NIST
1 2 (5.88%) QA
2 1 (2.94%) COBIT
2 1 (2.94%) GDPR
2 1 (2.94%) NIST 800
2 1 (2.94%) PMO
System Software
1 1 (2.94%) Hyper-V
1 1 (2.94%) Virtual Desktop
1 1 (2.94%) VMware Infrastructure
Vendors
1 14 (41.18%) Microsoft
2 1 (2.94%) Adobe
2 1 (2.94%) Amplitude
2 1 (2.94%) Bloomberg
2 1 (2.94%) Cognos
2 1 (2.94%) Facebook
2 1 (2.94%) Google
2 1 (2.94%) iManage
2 1 (2.94%) Instagram
2 1 (2.94%) Intapp
2 1 (2.94%) Murex
2 1 (2.94%) Salesforce
2 1 (2.94%) Sun
2 1 (2.94%) Twitter
2 1 (2.94%) Veeam
2 1 (2.94%) VMware