VMware Infrastructure Jobs in the City of London

VMware Infrastructure (VI3)
Central London > City of London

The table below provides summary statistics for permanent job vacancies advertised in the City of London requiring VMware Infrastructure skills. It includes a benchmarking guide to the annual salaries offered in vacancies that cited VMware Infrastructure over the 6 months leading up to 15 May 2025, comparing them to the same period in the previous two years.

6 months to
15 May 2025
Same period 2024 Same period 2023
Rank 92 112 118
Rank change year-on-year +20 +6 +36
Permanent jobs citing VMware Infrastructure 52 69 114
As % of all permanent jobs advertised in the City of London 2.56% 2.07% 2.46%
As % of the System Software category 20.31% 15.33% 12.57%
Number of salaries quoted 48 51 96
10th Percentile £36,800 £36,250 £41,563
25th Percentile £41,250 £47,250 £53,625
Median annual salary (50th Percentile) £53,750 £57,500 £65,000
Median % change year-on-year -6.52% -11.54% +13.04%
75th Percentile £80,313 £69,375 £75,188
90th Percentile £92,125 £77,500 £78,750
Central London median annual salary £56,250 £55,000 £65,000
% change year-on-year +2.27% -15.38% +18.18%

All System Software Skills
City of London

VMware Infrastructure falls under the System Software category. For comparison with the information above, the following table provides summary statistics for all permanent job vacancies requiring system software skills in the City of London.

Permanent vacancies with a requirement for system software skills 256 450 907
As % of all permanent jobs advertised in the City of London 12.60% 13.49% 19.60%
Number of salaries quoted 215 395 788
10th Percentile £36,250 £35,000 £35,750
25th Percentile £42,500 £46,250 £50,000
Median annual salary (50th Percentile) £62,500 £67,500 £70,000
Median % change year-on-year -7.41% -3.57% -3.45%
75th Percentile £84,375 £87,500 £92,500
90th Percentile £99,500 £106,250 £110,000
Central London median annual salary £62,250 £65,000 £70,000
% change year-on-year -4.23% -7.14% -3.45%

VMware Infrastructure
Job Vacancy Trend in the City of London

Job postings citing VMware Infrastructure as a proportion of all IT jobs advertised in the City of London.
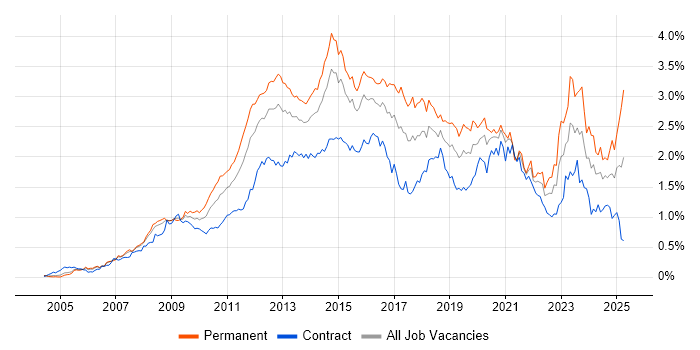
Job vacancy trend for VMware Infrastructure in the City of London

VMware Infrastructure
Salary Trend in the City of London

3-month moving average salary quoted in jobs citing VMware Infrastructure in the City of London.

Salary trend for VMware Infrastructure in the City of London

VMware Infrastructure
Salary Histogram in the City of London

Salary distribution for jobs citing VMware Infrastructure in the City of London over the 6 months to 15 May 2025.

Salary histogram for VMware Infrastructure in the City of London

VMware Infrastructure
Co-occurring Skills and Capabilities in the City of London by Category

The follow tables expand on the table above by listing co-occurrences grouped by category. The same employment type, locality and period is covered with up to 20 co-occurrences shown in each of the following categories:

Application Platforms
1 26 (50.00%) Microsoft Exchange
2 10 (19.23%) SharePoint
3 5 (9.62%) Exchange Server 2010
4 4 (7.69%) Exchange Server 2013
5 2 (3.85%) nginx
5 2 (3.85%) Tomcat
Applications
1 10 (19.23%) Microsoft Office
2 3 (5.77%) Microsoft PowerPoint
3 1 (1.92%) Microsoft Excel
3 1 (1.92%) MS Visio
Business Applications
1 3 (5.77%) Fidessa
Cloud Services
1 31 (59.62%) Azure
2 27 (51.92%) Microsoft 365
3 12 (23.08%) Entra ID
4 11 (21.15%) AWS
5 9 (17.31%) Azure DevOps
5 9 (17.31%) GitHub
5 9 (17.31%) OneDrive
5 9 (17.31%) PaaS
6 8 (15.38%) GitHub Actions
7 5 (9.62%) Cloud Computing
8 4 (7.69%) Azure ExpressRoute
8 4 (7.69%) Nutanix
9 3 (5.77%) SaaS
10 2 (3.85%) GCP
10 2 (3.85%) Mimecast
11 1 (1.92%) Google Workspace
11 1 (1.92%) IaaS
11 1 (1.92%) Power Platform
11 1 (1.92%) Serverless
Communications & Networking
1 13 (25.00%) DNS
2 11 (21.15%) DHCP
2 11 (21.15%) VPN
3 9 (17.31%) Firewall
3 9 (17.31%) VLAN
4 8 (15.38%) Network Security
4 8 (15.38%) WebEx
5 6 (11.54%) WAN
6 5 (9.62%) LAN
7 4 (7.69%) NetScaler
8 3 (5.77%) IPsec
8 3 (5.77%) SAN
9 2 (3.85%) Multicast
9 2 (3.85%) TCP/IP
10 1 (1.92%) Cisco IOS
10 1 (1.92%) IPv4
10 1 (1.92%) NAS
10 1 (1.92%) PBX
10 1 (1.92%) Remote Desktop
10 1 (1.92%) Structured Cabling
Database & Business Intelligence
1 8 (15.38%) SQL Server
2 2 (3.85%) Data Warehouse
2 2 (3.85%) MySQL
3 1 (1.92%) Amazon RDS
3 1 (1.92%) Data Hub
3 1 (1.92%) Metadata
3 1 (1.92%) Power BI
3 1 (1.92%) SQL CLR
3 1 (1.92%) SQL Server Analysis Services
3 1 (1.92%) SQL Server Reporting Services
Development Applications
1 3 (5.77%) Git
2 1 (1.92%) Eclipse
General
1 21 (40.38%) Social Skills
2 13 (25.00%) Analytical Skills
3 11 (21.15%) Finance
4 7 (13.46%) Banking
4 7 (13.46%) Inclusion and Diversity
5 4 (7.69%) Law
6 1 (1.92%) Back Office
6 1 (1.92%) Organisational Skills
Job Titles
1 18 (34.62%) Senior
2 9 (17.31%) Azure Engineer
3 8 (15.38%) Analyst
3 8 (15.38%) Senior Analyst
4 7 (13.46%) Administrator
4 7 (13.46%) Infrastructure Engineer
5 6 (11.54%) Azure Platform Engineer
5 6 (11.54%) Cloud Platform Engineer
5 6 (11.54%) IT Engineer
5 6 (11.54%) Platform Engineer
5 6 (11.54%) Senior Platform Engineer
6 5 (9.62%) 1st Line Support
6 5 (9.62%) IT Administrator
6 5 (9.62%) Senior Support Analyst
6 5 (9.62%) Support Analyst
7 4 (7.69%) Senior Technical Analyst
7 4 (7.69%) Server Engineer
7 4 (7.69%) Technical Analyst
7 4 (7.69%) Technical Support
7 4 (7.69%) Technical Support Analyst
Libraries, Frameworks & Software Standards
1 2 (3.85%) LEMP Stack
1 2 (3.85%) Node.js
2 1 (1.92%) LDAP
Miscellaneous
1 9 (17.31%) Self-Motivation
2 3 (5.77%) Onboarding
3 2 (3.85%) Analytical Mindset
3 2 (3.85%) Private Cloud
4 1 (1.92%) Cloud Native
4 1 (1.92%) Data Centre
4 1 (1.92%) Public Cloud
4 1 (1.92%) Video Conferencing
Operating Systems
1 39 (75.00%) Windows
2 22 (42.31%) Windows Server
3 18 (34.62%) Linux
4 14 (26.92%) Windows 10
5 8 (15.38%) Windows Server 2012
6 5 (9.62%) Red Hat Enterprise Linux
6 5 (9.62%) Windows Server 2008
6 5 (9.62%) Windows Server 2016
7 4 (7.69%) Apple iOS
7 4 (7.69%) Windows 7
8 2 (3.85%) CentOS
8 2 (3.85%) Rocky
8 2 (3.85%) Windows Server 2019
9 1 (1.92%) Android
9 1 (1.92%) Mac OS
9 1 (1.92%) Mac OS X
Processes & Methodologies
1 27 (51.92%) Problem-Solving
2 14 (26.92%) DevOps
3 13 (25.00%) ITIL
4 12 (23.08%) CI/CD
4 12 (23.08%) Customer Service
5 10 (19.23%) Platform Engineering
6 9 (17.31%) Continuous Improvement
6 9 (17.31%) Infrastructure Engineering
7 8 (15.38%) Disaster Recovery
7 8 (15.38%) Regulatory Compliance
8 6 (11.54%) Asset Management
9 5 (9.62%) Break/Fix
9 5 (9.62%) Capacity Planning
9 5 (9.62%) Change Control
9 5 (9.62%) Infrastructure as Code
9 5 (9.62%) Inventory Management
9 5 (9.62%) ITSM
9 5 (9.62%) Trend Analysis
10 4 (7.69%) Application Security
10 4 (7.69%) Infrastructure Automation
Programming Languages
1 8 (15.38%) PowerShell
2 4 (7.69%) Bash
2 4 (7.69%) Python
2 4 (7.69%) SQL
3 2 (3.85%) JavaScript
4 1 (1.92%) T-SQL
Qualifications
1 14 (26.92%) Degree
2 7 (13.46%) Microsoft Certification
3 4 (7.69%) DV Cleared
3 4 (7.69%) MCSA
3 4 (7.69%) Security Cleared
4 3 (5.77%) ITIL Foundation Certificate
5 2 (3.85%) MCSE
6 1 (1.92%) CCENT
6 1 (1.92%) CCNA
6 1 (1.92%) Cisco Certification
6 1 (1.92%) Computer Science Degree
6 1 (1.92%) Network+ Certification
6 1 (1.92%) RHCSA
6 1 (1.92%) VCAP
6 1 (1.92%) VMware Certified Professional (VCP)
Quality Assurance & Compliance
1 5 (9.62%) SLA
2 4 (7.69%) GDPR
3 2 (3.85%) QA
4 1 (1.92%) ISO/IEC 27001
System Software
1 35 (67.31%) Active Directory
2 11 (21.15%) Virtual Desktop
3 8 (15.38%) Hyper-V
4 6 (11.54%) VMware ESXi
5 2 (3.85%) Virtual Servers
5 2 (3.85%) vSphere
6 1 (1.92%) Microsoft Virtual Server
6 1 (1.92%) XenDesktop
Systems Management
1 18 (34.62%) Microsoft Intune
2 12 (23.08%) Terraform
3 5 (9.62%) SCCM
4 4 (7.69%) Ansible
4 4 (7.69%) vCenter Server
5 3 (5.77%) Nagios
5 3 (5.77%) Single Sign-On
6 2 (3.85%) Red Hat Satellite
6 2 (3.85%) SCOM
7 1 (1.92%) Failover Clustering
7 1 (1.92%) Jamf Pro
7 1 (1.92%) Kubernetes
7 1 (1.92%) WSUS
Vendors
1 52 (100.00%) VMware
2 35 (67.31%) Microsoft
3 14 (26.92%) Citrix
4 11 (21.15%) HP
5 8 (15.38%) Apple
5 8 (15.38%) Cisco
6 7 (13.46%) Red Hat
7 6 (11.54%) Veeam
8 3 (5.77%) Bloomberg
8 3 (5.77%) FactSet
8 3 (5.77%) Fortinet
8 3 (5.77%) Mitel
8 3 (5.77%) NetApp
8 3 (5.77%) Refinitiv
8 3 (5.77%) ServiceNow
8 3 (5.77%) SolarWinds
9 2 (3.85%) Commvault
9 2 (3.85%) Meraki
9 2 (3.85%) Nimble Storage
10 1 (1.92%) Isilon