Software Engineering Jobs in the Midlands

Software Engineering
England > Midlands

The following table provides summary statistics for permanent job vacancies advertised in the Midlands with a requirement for Software Engineering skills. Included is a benchmarking guide to the salaries offered in vacancies that have cited Software Engineering over the 6 months to 7 December 2023 with a comparison to the same period in the previous 2 years.

6 months to
7 Dec 2023
Same period 2022 Same period 2021
Rank 24 23 27
Rank change year-on-year -1 +4 +3
Permanent jobs citing Software Engineering 389 1,102 794
As % of all permanent jobs advertised in the Midlands 7.75% 9.91% 7.36%
As % of the Processes & Methodologies category 8.34% 10.30% 7.76%
Number of salaries quoted 277 594 577
10th Percentile £37,300 £37,770 £31,250
25th Percentile £46,500 £46,250 £37,500
Median annual salary (50th Percentile) £57,500 £60,000 £55,000
Median % change year-on-year -4.17% +9.09% +10.00%
75th Percentile £68,750 £75,000 £75,000
90th Percentile £78,500 £85,000 £95,000
England median annual salary £70,000 £70,000 £70,000
% change year-on-year - - +16.67%

All Process and Methodology Skills
Midlands

Software Engineering is in the Processes and Methodologies category. The following table is for comparison with the above and provides summary statistics for all permanent job vacancies advertised in the Midlands with a requirement for process or methodology skills.

Permanent vacancies with a requirement for process or methodology skills 4,667 10,697 10,238
As % of all permanent jobs advertised in the Midlands 92.99% 96.22% 94.95%
Number of salaries quoted 3,496 6,067 7,418
10th Percentile £26,500 £31,000 £29,500
25th Percentile £36,250 £40,000 £37,066
Median annual salary (50th Percentile) £50,000 £52,500 £50,000
Median % change year-on-year -4.76% +5.00% +6.38%
75th Percentile £63,750 £66,250 £65,000
90th Percentile £76,250 £80,000 £78,750
England median annual salary £60,000 £62,500 £60,000
% change year-on-year -4.00% +4.17% +9.09%

Software Engineering
Job Vacancy Trend in the Midlands

Job postings citing Software Engineering as a proportion of all IT jobs advertised in the Midlands.
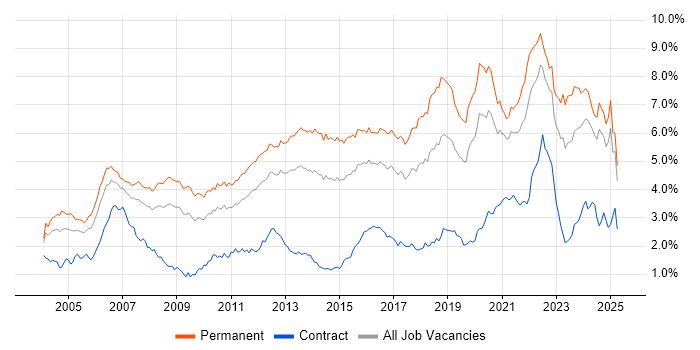
Job vacancy trend for Software Engineering in the Midlands

Software Engineering
Salary Trend in the Midlands

3-month moving average salary quoted in jobs citing Software Engineering in the Midlands.

Salary trend for Software Engineering in the Midlands

Software Engineering
Salary Histogram in the Midlands

Salary distribution for jobs citing Software Engineering in the Midlands over the 6 months to 7 December 2023.

Salary histogram for Software Engineering in the Midlands

Software Engineering
Job Locations in the Midlands

The table below looks at the demand and provides a guide to the median salaries quoted in IT jobs citing Software Engineering within the Midlands region over the 6 months to 7 December 2023. The 'Rank Change' column provides an indication of the change in demand within each location based on the same 6 month period last year.

Location Rank Change
on Same Period
Last Year
Matching
Permanent
IT Job Ads
Median Salary
Past 6 Months
Median Salary
% Change
on Same Period
Last Year
Live
Jobs
West Midlands -13 209 £57,500 -4.17% 148
East Midlands +4 180 £55,000 -8.33% 76
Software Engineering
England

Software Engineering
Co-occurring Skills and Capabilities in the Midlands by Category

The follow tables expand on the table above by listing co-occurrences grouped by category. The same employment type, locality and period is covered with up to 20 co-occurrences shown in each of the following categories:

Application Platforms
1 7 (1.80%) JBoss
1 7 (1.80%) Red Hat Fuse
2 5 (1.29%) NServiceBus
3 4 (1.03%) CMS
3 4 (1.03%) IIS
3 4 (1.03%) OpenEdge
3 4 (1.03%) SAS
4 3 (0.77%) Confluence
4 3 (0.77%) SharePoint
5 1 (0.26%) Apache Spark
5 1 (0.26%) Drupal
5 1 (0.26%) Umbraco
Applications
1 11 (2.83%) Simulink
2 6 (1.54%) Adobe XD
3 2 (0.51%) TargetLink
4 1 (0.26%) CANalyzer
4 1 (0.26%) Microsoft Office
4 1 (0.26%) MS Visio
4 1 (0.26%) Stateflow
Business Applications
1 4 (1.03%) ProductWriter
2 1 (0.26%) SAP CRM
Cloud Services
1 97 (24.94%) Azure
2 87 (22.37%) AWS
3 35 (9.00%) Serverless
4 34 (8.74%) Azure DevOps
5 26 (6.68%) GCP
6 24 (6.17%) SaaS
7 13 (3.34%) Azure App Service
8 11 (2.83%) GitHub
9 6 (1.54%) OpenShift
10 5 (1.29%) Azure Cosmos DB
10 5 (1.29%) Cloud Computing
11 3 (0.77%) AWS CloudFormation
11 3 (0.77%) AWS Lambda
11 3 (0.77%) AWS Step Functions
11 3 (0.77%) Microsoft 365
11 3 (0.77%) PaaS
12 2 (0.51%) Amazon EC2
12 2 (0.51%) Azure ExpressRoute
12 2 (0.51%) Dynamics 365
12 2 (0.51%) Power Platform
Communications & Networking
1 11 (2.83%) Wireless
2 10 (2.57%) HTTP
3 9 (2.31%) Bluetooth
4 8 (2.06%) TCP/IP
5 6 (1.54%) Internet
6 5 (1.29%) 5G
6 5 (1.29%) FlexRay
6 5 (1.29%) J1939
7 4 (1.03%) Ethernet
7 4 (1.03%) GSM
7 4 (1.03%) SD-WAN
7 4 (1.03%) WAN
8 3 (0.77%) Wi-Fi
9 2 (0.51%) 2G
9 2 (0.51%) 3G
9 2 (0.51%) 4G
9 2 (0.51%) DHCP
9 2 (0.51%) DNS
9 2 (0.51%) IPv6
9 2 (0.51%) VPN
Database & Business Intelligence
1 38 (9.77%) SQL Server
2 22 (5.66%) NoSQL
3 18 (4.63%) Relational Database
4 13 (3.34%) MongoDB
5 12 (3.08%) RDBMS
6 11 (2.83%) MySQL
7 10 (2.57%) PostgreSQL
8 7 (1.80%) Apache Cassandra
8 7 (1.80%) Big Data
8 7 (1.80%) Oracle Database
9 4 (1.03%) Event Store
9 4 (1.03%) RavenDB
10 3 (0.77%) DynamoDB
11 2 (0.51%) Amazon RDS
11 2 (0.51%) Amazon Redshift
11 2 (0.51%) Couchbase
11 2 (0.51%) Elasticsearch
11 2 (0.51%) Parquet
11 2 (0.51%) SQLite
12 1 (0.26%) DTS
Development Applications
1 53 (13.62%) Git
2 16 (4.11%) Visual Studio
3 14 (3.60%) JIRA
4 12 (3.08%) GitLab
5 8 (2.06%) IntelliJ
5 8 (2.06%) Jenkins
6 7 (1.80%) Cucumber
7 4 (1.03%) Mercurial
7 4 (1.03%) SpecFlow
7 4 (1.03%) Subversion
8 3 (0.77%) Bitbucket
8 3 (0.77%) CANoe
8 3 (0.77%) CMake
8 3 (0.77%) JDeveloper
8 3 (0.77%) Oracle APEX
8 3 (0.77%) Rational DOORS
8 3 (0.77%) VectorCAST
9 2 (0.51%) eggPlant
9 2 (0.51%) Jasmine
9 2 (0.51%) MSBuild
General
1 65 (16.71%) Social Skills
2 58 (14.91%) Finance
3 30 (7.71%) Analytical Skills
4 28 (7.20%) Automotive
5 26 (6.68%) Electronics
6 21 (5.40%) Law
6 21 (5.40%) Public Sector
7 19 (4.88%) Inclusion and Diversity
8 18 (4.63%) Manufacturing
9 15 (3.86%) Marketing
10 13 (3.34%) Police
11 12 (3.08%) Games
12 10 (2.57%) Presentation Skills
13 9 (2.31%) Banking
13 9 (2.31%) Telecoms
14 8 (2.06%) Retail
15 7 (1.80%) Aerospace
16 6 (1.54%) Billing
16 6 (1.54%) Tech for Good
17 5 (1.29%) Organisational Skills
Job Titles
1 190 (48.84%) Software Engineer
2 114 (29.31%) Senior
3 71 (18.25%) Developer
4 60 (15.42%) Embedded Engineer
5 59 (15.17%) Senior Software Engineer
6 38 (9.77%) Embedded Software Engineer
7 29 (7.46%) Lead
8 26 (6.68%) Architect
9 23 (5.91%) Solutions Architect
10 22 (5.66%) C# Developer
10 22 (5.66%) C# Software Engineer
10 22 (5.66%) Java Engineer
10 22 (5.66%) Senior Embedded Engineer
11 21 (5.40%) Java Software Engineer
11 21 (5.40%) Senior Developer
12 19 (4.88%) C++ Software Engineer
13 17 (4.37%) Embedded C++ Engineer
13 17 (4.37%) Linux Engineer
14 16 (4.11%) Full Stack Developer
15 15 (3.86%) Senior DevOps
Libraries, Frameworks & Software Standards
1 96 (24.68%) React
2 90 (23.14%) .NET
3 73 (18.77%) AngularJS
4 48 (12.34%) HTML
5 42 (10.80%) CSS
6 37 (9.51%) Node.js
7 34 (8.74%) .NET Framework
8 31 (7.97%) ASP.NET
9 27 (6.94%) RESTful
10 26 (6.68%) Spring
11 20 (5.14%) Middleware
12 19 (4.88%) REST
13 18 (4.63%) .NET Core
14 15 (3.86%) Blazor
14 15 (3.86%) JSON
14 15 (3.86%) XML
15 14 (3.60%) Yocto
16 12 (3.08%) jQuery
16 12 (3.08%) Ruby on Rails
16 12 (3.08%) Web Services
Miscellaneous
1 22 (5.66%) Product Ownership
2 21 (5.40%) Management Information System
3 18 (4.63%) Self-Motivation
4 15 (3.86%) Embedded Systems
4 15 (3.86%) Mobile App
5 9 (2.31%) Algorithms
5 9 (2.31%) Cloud Native
5 9 (2.31%) IoT
6 8 (2.06%) Onboarding
7 6 (1.54%) Mobile Games
8 5 (1.29%) Legacy Systems
8 5 (1.29%) Virtual Team
9 4 (1.03%) Analytical Mindset
9 4 (1.03%) Enterprise Software
9 4 (1.03%) GNSS
9 4 (1.03%) NHS
10 3 (0.77%) Legacy Code
11 2 (0.51%) Greenfield Project
11 2 (0.51%) Infotainment
11 2 (0.51%) Private Cloud
Operating Systems
1 44 (11.31%) Linux
2 16 (4.11%) Embedded Linux
3 14 (3.60%) Android
3 14 (3.60%) Unix
4 7 (1.80%) Apple iOS
5 6 (1.54%) Windows
6 5 (1.29%) FreeRTOS
Processes & Methodologies
1 153 (39.33%) Agile
2 109 (28.02%) DevOps
3 94 (24.16%) Problem-Solving
4 72 (18.51%) Microservices
5 71 (18.25%) Mentoring
6 59 (15.17%) CI/CD
7 57 (14.65%) Design Patterns
8 47 (12.08%) SDLC
9 46 (11.83%) Continuous Integration
10 45 (11.57%) Containerisation
11 42 (10.80%) Coaching
11 42 (10.80%) Computer Science
11 42 (10.80%) Full Stack Development
12 40 (10.28%) Actionable Insight
13 39 (10.03%) Unit Testing
14 34 (8.74%) Scrum
15 32 (8.23%) Code Quality
16 30 (7.71%) Event-Driven
17 29 (7.46%) B2B
17 29 (7.46%) Event-Driven Architecture
Programming Languages
1 106 (27.25%) C#
2 86 (22.11%) JavaScript
3 82 (21.08%) SQL
4 63 (16.20%) Java
4 63 (16.20%) Python
5 56 (14.40%) C
6 52 (13.37%) C++
7 51 (13.11%) TypeScript
8 20 (5.14%) Ruby
9 17 (4.37%) Bash
10 16 (4.11%) MATLAB
11 14 (3.60%) Go
12 13 (3.34%) T-SQL
13 12 (3.08%) Perl
14 9 (2.31%) PHP
15 8 (2.06%) Embedded C
16 6 (1.54%) Embedded C++
16 6 (1.54%) PowerShell
16 6 (1.54%) R
16 6 (1.54%) Rust
Qualifications
1 72 (18.51%) Degree
2 53 (13.62%) Security Cleared
3 46 (11.83%) SC Cleared
4 17 (4.37%) Computer Science Degree
5 8 (2.06%) Master's Degree
6 7 (1.80%) DV Cleared
7 5 (1.29%) Chartered Engineer
7 5 (1.29%) HND
8 3 (0.77%) AWS Certification
9 2 (0.51%) AWS Certified Cloud Practitioner
9 2 (0.51%) BPSS Clearance
9 2 (0.51%) MCSE
9 2 (0.51%) Microsoft Certification
9 2 (0.51%) PhD
9 2 (0.51%) Six Sigma Yellow Belt
10 1 (0.26%) APMP
10 1 (0.26%) HNC
10 1 (0.26%) Postgraduate
10 1 (0.26%) SAFe Agilist
Quality Assurance & Compliance
1 25 (6.43%) QA
2 18 (4.63%) MISRA
3 15 (3.86%) AUTOSAR
4 12 (3.08%) ISO 26262
5 8 (2.06%) DO-178B
6 5 (1.29%) IEC 61508
7 4 (1.03%) Automotive SPICE
7 4 (1.03%) PMO
8 3 (0.77%) MISRA C
9 2 (0.51%) ISO/IEC 27001
9 2 (0.51%) JTAG
System Software
1 48 (12.34%) Docker
2 39 (10.03%) Firmware
3 12 (3.08%) Embedded Firmware
4 1 (0.26%) Active Directory
4 1 (0.26%) VMware Infrastructure
Systems Management
1 28 (7.20%) Kubernetes
2 9 (2.31%) Puppet
3 5 (1.29%) Terraform
4 3 (0.77%) Functional Safety
5 1 (0.26%) Ansible
5 1 (0.26%) Grafana
5 1 (0.26%) Microsoft Intune
5 1 (0.26%) Prometheus
Vendors
1 36 (9.25%) Microsoft
2 11 (2.83%) Oracle
3 10 (2.57%) Google
3 10 (2.57%) Xamarin
4 9 (2.31%) SAP
5 6 (1.54%) Adobe
6 4 (1.03%) Guidewire
6 4 (1.03%) Progress
6 4 (1.03%) ServiceNow
7 3 (0.77%) Apple
7 3 (0.77%) Cisco
7 3 (0.77%) VMware
8 2 (0.51%) Atlassian
8 2 (0.51%) Fortinet
8 2 (0.51%) Lauterbach
8 2 (0.51%) Palo Alto
8 2 (0.51%) Remedy
8 2 (0.51%) Salesforce
9 1 (0.26%) Klarna
9 1 (0.26%) MuleSoft