SC Cleared Jobs in the Midlands

Security Check (SC) Clearance
England > Midlands

The table below provides summary statistics for permanent job vacancies advertised in the Midlands with a requirement for SC Cleared qualifications. It includes a benchmarking guide to the salaries offered over the 6 months leading up to 26 July 2024, comparing them to the same period in the previous two years.

6 months to
26 Jul 2024
Same period 2023 Same period 2022
Rank 81 58 124
Rank change year-on-year -23 +66 -64
Permanent jobs citing SC Cleared 354 403 332
As % of all permanent jobs advertised in the Midlands 3.05% 5.31% 2.69%
As % of the Qualifications category 11.74% 13.42% 8.35%
Number of salaries quoted 219 251 182
10th Percentile £30,000 £39,700 £26,550
25th Percentile £41,000 £46,250 £41,250
Median annual salary (50th Percentile) £52,500 £60,000 £55,000
Median % change year-on-year -12.50% +9.09% -4.35%
75th Percentile £64,554 £67,500 £70,938
90th Percentile £77,750 £80,000 £86,250
England median annual salary £55,000 £62,500 £55,000
% change year-on-year -12.00% +13.64% -0.16%

All Academic and Professional Certifications
Midlands

SC Cleared falls under the Academic Qualifications and Professional Certifications category. For comparison with the information above, the following table provides summary statistics for all permanent job vacancies requiring academic qualifications or professional certifications in the Midlands.

Permanent vacancies requiring academic qualifications or professional certifications 3,016 3,004 3,977
As % of all permanent jobs advertised in the Midlands 25.96% 39.56% 32.25%
Number of salaries quoted 1,420 1,260 2,115
10th Percentile £26,250 £28,950 £27,500
25th Percentile £32,938 £37,500 £35,125
Median annual salary (50th Percentile) £48,500 £52,175 £46,000
Median % change year-on-year -7.04% +13.42% -3.16%
75th Percentile £62,200 £63,750 £60,000
90th Percentile £77,500 £75,000 £77,500
England median annual salary £55,000 £60,000 £55,000
% change year-on-year -8.33% +9.09% -

SC Cleared
Job Vacancy Trend in the Midlands

Job postings citing SC Cleared as a proportion of all IT jobs advertised in the Midlands.
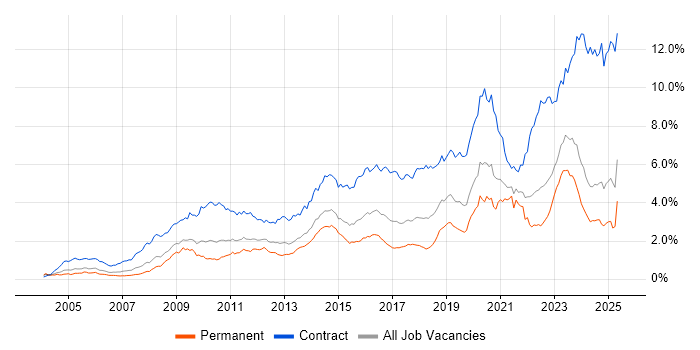
Job vacancy trend for SC Cleared in the Midlands

SC Cleared
Salary Trend in the Midlands

3-month moving average salary quoted in jobs citing SC Cleared in the Midlands.

Salary trend for SC Cleared in the Midlands

SC Cleared
Salary Histogram in the Midlands

Salary distribution for jobs citing SC Cleared in the Midlands over the 6 months to 26 July 2024.

Salary histogram for SC Cleared in the Midlands

SC Cleared
Job Locations in the Midlands

The table below looks at the demand and provides a guide to the median salaries quoted in IT jobs citing SC Cleared within the Midlands region over the 6 months to 26 July 2024. The 'Rank Change' column provides an indication of the change in demand within each location based on the same 6 month period last year.

Location Rank Change
on Same Period
Last Year
Matching
Permanent
IT Job Ads
Median Salary
Past 6 Months
Median Salary
% Change
on Same Period
Last Year
Live
Jobs
West Midlands +2 257 £55,000 -8.33% 47
East Midlands -64 97 £44,225 -15.76% 8
SC Cleared
England

SC Cleared
Co-occurring Skills and Capabilities in the Midlands by Category

The follow tables expand on the table above by listing co-occurrences grouped by category. The same employment type, locality and period is covered with up to 20 co-occurrences shown in each of the following categories:

Application Platforms
1 18 (5.08%) ArcGIS
1 18 (5.08%) GeoServer
2 9 (2.54%) Appian
3 6 (1.69%) SharePoint
4 5 (1.41%) Microsoft Exchange
5 4 (1.13%) Confluence
5 4 (1.13%) Office Communications Server
5 4 (1.13%) WebLogic
6 2 (0.56%) IIS
Applications
1 9 (2.54%) Microsoft Office
2 6 (1.69%) Microsoft Project
2 6 (1.69%) Simulink
3 4 (1.13%) Sketch
4 3 (0.85%) AutoCAD
5 2 (0.56%) EPLAN
5 2 (0.56%) Microsoft Excel
5 2 (0.56%) MS Visio
Business Applications
1 4 (1.13%) Sparx Enterprise Architect
2 3 (0.85%) Remedy ITSM
3 2 (0.56%) Dynamics CRM
4 1 (0.28%) CA PPM
4 1 (0.28%) Maximo
4 1 (0.28%) Oracle ERP
Cloud Services
1 94 (26.55%) Azure
2 53 (14.97%) AWS
3 26 (7.34%) Entra ID
4 22 (6.21%) Microsoft 365
5 13 (3.67%) Azure ExpressRoute
5 13 (3.67%) Power Platform
6 10 (2.82%) dbt
7 9 (2.54%) Dynamics 365
8 7 (1.98%) PowerApps
9 6 (1.69%) Azure Sentinel
9 6 (1.69%) Miro
10 5 (1.41%) Azure DevOps
10 5 (1.41%) GCP
11 4 (1.13%) Amazon EKS
11 4 (1.13%) Amazon SQS
11 4 (1.13%) Figma
11 4 (1.13%) Heroku
11 4 (1.13%) Power Automate
11 4 (1.13%) Virtual Private Cloud
12 3 (0.85%) Azure Data Factory
Communications & Networking
1 44 (12.43%) Firewall
1 44 (12.43%) WAN
2 28 (7.91%) SD-WAN
3 25 (7.06%) MPLS
4 24 (6.78%) IPsec
5 19 (5.37%) DNS
6 17 (4.80%) 5G
7 11 (3.11%) BGP
7 11 (3.11%) DHCP
7 11 (3.11%) Wi-Fi
7 11 (3.11%) Wireless
8 10 (2.82%) Network Security
9 8 (2.26%) LAN
10 7 (1.98%) 3GPP
10 7 (1.98%) Cisco Firepower
11 6 (1.69%) TCP/IP
11 6 (1.69%) VSAN
12 5 (1.41%) Cisco Nexus
12 5 (1.41%) NetScaler
12 5 (1.41%) SAN
Database & Business Intelligence
1 18 (5.08%) GIS
1 18 (5.08%) PostgreSQL
1 18 (5.08%) QGIS
2 11 (3.11%) SQL Server
3 6 (1.69%) Data Warehouse
3 6 (1.69%) Power BI
4 5 (1.41%) MySQL
4 5 (1.41%) RDBMS
4 5 (1.41%) Relational Database
5 4 (1.13%) Amazon RDS
5 4 (1.13%) Oracle Database
6 2 (0.56%) Amazon Redshift
6 2 (0.56%) Data Lake
6 2 (0.56%) Oracle Reports
6 2 (0.56%) Pentaho
7 1 (0.28%) Azure SQL Database
7 1 (0.28%) SQL Server Analysis Services
7 1 (0.28%) SQL Server Integration Services
7 1 (0.28%) SQL Server Reporting Services
Development Applications
1 13 (3.67%) JIRA
2 12 (3.39%) Rational DOORS
3 5 (1.41%) GitLab
4 4 (1.13%) Git
5 3 (0.85%) Axure RP
5 3 (0.85%) Zephyr
6 2 (0.56%) Postman
7 1 (0.28%) Appium
7 1 (0.28%) Bitbucket
7 1 (0.28%) Jenkins
7 1 (0.28%) JUnit
7 1 (0.28%) Selenium
7 1 (0.28%) SonarQube
7 1 (0.28%) Terragrunt
7 1 (0.28%) TestNG
General
1 68 (19.21%) Social Skills
2 38 (10.73%) Inclusion and Diversity
3 31 (8.76%) Telecoms
4 27 (7.63%) Finance
5 16 (4.52%) Police
6 15 (4.24%) Manufacturing
6 15 (4.24%) Retail
7 13 (3.67%) Military
7 13 (3.67%) Public Sector
8 9 (2.54%) Influencing Skills
9 7 (1.98%) Legal
10 5 (1.41%) Aerospace
10 5 (1.41%) Documentation Skills
11 4 (1.13%) Electronics
11 4 (1.13%) Organisational Skills
12 3 (0.85%) Turkish Language
13 2 (0.56%) Analytical Skills
13 2 (0.56%) Presentation Skills
13 2 (0.56%) Welsh Language
14 1 (0.28%) Marketing
Job Titles
1 76 (21.47%) Senior
2 71 (20.06%) Network Engineer
3 46 (12.99%) Architect
4 35 (9.89%) Developer
5 27 (7.63%) Software Engineer
6 26 (7.34%) Solutions Architect
7 25 (7.06%) Lead
8 21 (5.93%) Infrastructure Engineer
9 17 (4.80%) Project Manager
9 17 (4.80%) Senior Software Engineer
10 13 (3.67%) Analyst
10 13 (3.67%) Azure Engineer
11 12 (3.39%) WAN Engineer
12 11 (3.11%) Technical Architect
13 10 (2.82%) Security Engineer
14 9 (2.54%) Appian Developer
14 9 (2.54%) Cybersecurity Engineer
14 9 (2.54%) IT Engineer
14 9 (2.54%) Service Architect
15 8 (2.26%) Low-Code Developer
Libraries, Frameworks & Software Standards
1 27 (7.63%) .NET
2 24 (6.78%) React
3 20 (5.65%) .NET Core
4 18 (5.08%) CSS
4 18 (5.08%) Leaflet
4 18 (5.08%) OpenLayers
4 18 (5.08%) PostGIS
5 12 (3.39%) 802.1X
6 8 (2.26%) Django
7 7 (1.98%) HTML
7 7 (1.98%) Node.js
8 5 (1.41%) Spring Boot
9 4 (1.13%) RabbitMQ
10 2 (0.56%) ASP.NET
10 2 (0.56%) ASP.NET MVC
10 2 (0.56%) REST
10 2 (0.56%) RESTful
10 2 (0.56%) SOAP
10 2 (0.56%) Web Services
10 2 (0.56%) WebRTC
Miscellaneous
1 20 (5.65%) Management Information System
2 13 (3.67%) Data Centre
3 9 (2.54%) Driving Licence
3 9 (2.54%) Operational Technology
4 8 (2.26%) Low-Code
4 8 (2.26%) Virtual Team
5 7 (1.98%) CMDB
5 7 (1.98%) Security Operations Centre
6 6 (1.69%) Cloud Native
6 6 (1.69%) PKI
6 6 (1.69%) Public Cloud
6 6 (1.69%) SCADA
7 4 (1.13%) Enterprise Software
7 4 (1.13%) Product Ownership
7 4 (1.13%) Self-Motivation
8 3 (0.85%) Clustering
8 3 (0.85%) IBM Mainframe
8 3 (0.85%) Mainframe
8 3 (0.85%) Private Cloud
8 3 (0.85%) Renewable Energy
Operating Systems
1 36 (10.17%) Windows
2 22 (6.21%) Windows Server
3 19 (5.37%) Linux
4 9 (2.54%) Android
4 9 (2.54%) Red Hat Enterprise Linux
4 9 (2.54%) Windows Server 2016
5 6 (1.69%) Windows Server 2019
6 4 (1.13%) Windows 10
7 3 (0.85%) Ubuntu
7 3 (0.85%) Windows Server 2003
7 3 (0.85%) zOS
8 2 (0.56%) Windows Server 2012
9 1 (0.28%) Apple iOS
9 1 (0.28%) Unix
9 1 (0.28%) Windows Server 2008
Processes & Methodologies
1 96 (27.12%) Agile
2 58 (16.38%) Cybersecurity
3 57 (16.10%) Actionable Insight
4 54 (15.25%) ITIL
5 48 (13.56%) DevOps
6 43 (12.15%) Software Engineering
7 38 (10.73%) Project Management
8 36 (10.17%) Mentoring
8 36 (10.17%) Problem-Solving
9 35 (9.89%) Infrastructure Engineering
10 30 (8.47%) Service Management
11 26 (7.34%) Stakeholder Management
12 24 (6.78%) Change Management
13 22 (6.21%) Systems Engineering
14 21 (5.93%) Customer Service
15 20 (5.65%) Project Delivery
16 18 (5.08%) Configuration Management
16 18 (5.08%) Web Development
17 17 (4.80%) Continuous Improvement
17 17 (4.80%) Migration
Programming Languages
1 50 (14.12%) Python
2 44 (12.43%) JavaScript
3 25 (7.06%) C#
4 15 (4.24%) PowerShell
5 13 (3.67%) MATLAB
5 13 (3.67%) SQL
6 10 (2.82%) TypeScript
7 6 (1.69%) Java
8 2 (0.56%) C
8 2 (0.56%) Kusto Query Language
9 1 (0.28%) C++
9 1 (0.28%) R
9 1 (0.28%) T-SQL
Qualifications
1 354 (100.00%) Security Cleared
2 50 (14.12%) DV Cleared
3 43 (12.15%) Degree
4 22 (6.21%) Cisco Certification
5 20 (5.65%) CCNA
6 13 (3.67%) Microsoft Certification
7 12 (3.39%) AWS Certification
8 11 (3.11%) VMware Certified Professional (VCP)
9 9 (2.54%) Azure Certification
10 8 (2.26%) CCNP
10 8 (2.26%) Computer Science Degree
11 5 (1.41%) MCSA
11 5 (1.41%) MCSE
11 5 (1.41%) RHCSA
12 4 (1.13%) BPSS Clearance
12 4 (1.13%) CCSA
12 4 (1.13%) HND
12 4 (1.13%) Network+ Certification
12 4 (1.13%) PRINCE2 Practitioner
12 4 (1.13%) SANS
Quality Assurance & Compliance
1 19 (5.37%) NCSC
2 14 (3.95%) Accessibility
3 12 (3.39%) QA
4 7 (1.98%) ISO/IEC 27001
5 6 (1.69%) NIST
5 6 (1.69%) NIST 800
6 5 (1.41%) Data Quality
6 5 (1.41%) PMO
6 5 (1.41%) WCAG
7 4 (1.13%) ISO/IEC 20000
7 4 (1.13%) Sarbanes-Oxley
8 3 (0.85%) COBIT
9 2 (0.56%) Cyber Essentials
9 2 (0.56%) JSP 440
9 2 (0.56%) SLA
10 1 (0.28%) GRC
System Software
1 27 (7.63%) Active Directory
2 24 (6.78%) VMware Infrastructure
3 20 (5.65%) vSphere
4 5 (1.41%) Hyper-V
4 5 (1.41%) VMware ESXi
4 5 (1.41%) XenDesktop
5 4 (1.13%) VMware NSX
6 3 (0.85%) Docker
6 3 (0.85%) Virtual Machines
7 1 (0.28%) Virtual Desktop
7 1 (0.28%) Virtual Servers
Systems Management
1 15 (4.24%) SCCM
2 8 (2.26%) SCOM
3 7 (1.98%) Kubernetes
3 7 (1.98%) Microsoft Intune
3 7 (1.98%) VxRail
4 6 (1.69%) FortiGate
5 5 (1.41%) Active Directory Federation Services
5 5 (1.41%) EMC NetWorker
5 5 (1.41%) vCenter Server
6 3 (0.85%) Ansible
6 3 (0.85%) Nagios
6 3 (0.85%) OpenView
6 3 (0.85%) Terraform
7 1 (0.28%) AirWatch
7 1 (0.28%) Grafana
7 1 (0.28%) Microsoft Clustering
7 1 (0.28%) SCSM
Vendors
1 62 (17.51%) Microsoft
2 46 (12.99%) Cisco
3 37 (10.45%) Juniper
4 36 (10.17%) VMware
5 19 (5.37%) Dell
6 18 (5.08%) ESRI
7 15 (4.24%) Aruba
8 13 (3.67%) ServiceNow
9 12 (3.39%) Oracle
10 11 (3.11%) Fortinet
11 10 (2.82%) CheckPoint
12 8 (2.26%) Citrix
12 8 (2.26%) EMC
12 8 (2.26%) Meraki
13 7 (1.98%) HP
13 7 (1.98%) IFS
14 5 (1.41%) F5
14 5 (1.41%) Red Hat
15 4 (1.13%) Palo Alto
15 4 (1.13%) Talend