JavaScript Jobs in the Midlands

JavaScript (including ECMAScript)
England > Midlands

The table below provides summary statistics for permanent job vacancies advertised in the Midlands requiring JavaScript skills. It includes a benchmarking guide to the annual salaries offered in vacancies that cited JavaScript over the 6 months leading up to 26 October 2024, comparing them to the same period in the previous two years.

6 months to
26 Oct 2024
Same period 2023 Same period 2022
Rank 29 25 17
Rank change year-on-year -4 -8 -10
Permanent jobs citing JavaScript 550 428 1,237
As % of all permanent jobs advertised in the Midlands 5.95% 7.70% 11.00%
As % of the Programming Languages category 25.25% 22.10% 27.75%
Number of salaries quoted 257 385 660
10th Percentile £32,400 £36,350 £36,250
25th Percentile £40,000 £42,500 £43,750
Median annual salary (50th Percentile) £52,500 £55,000 £55,000
Median % change year-on-year -4.55% - +15.79%
75th Percentile £70,000 £67,500 £67,500
90th Percentile £75,500 £72,500 £77,500
England median annual salary £65,000 £65,000 £62,500
% change year-on-year - +4.00% +8.70%

All Programming Languages
Midlands

JavaScript falls under the Programming Languages category. For comparison with the information above, the following table provides summary statistics for all permanent job vacancies requiring coding skills in the Midlands.

Permanent vacancies with a requirement for coding skills 2,178 1,937 4,457
As % of all permanent jobs advertised in the Midlands 23.57% 34.86% 39.65%
Number of salaries quoted 1,176 1,528 2,865
10th Percentile £32,500 £35,000 £34,825
25th Percentile £38,750 £42,500 £42,500
Median annual salary (50th Percentile) £52,500 £54,000 £52,500
Median % change year-on-year -2.78% +2.86% +10.53%
75th Percentile £65,000 £66,250 £67,500
90th Percentile £75,000 £75,000 £80,000
England median annual salary £65,000 £65,000 £65,000
% change year-on-year - - +8.33%

JavaScript
Job Vacancy Trend in the Midlands

Job postings citing JavaScript as a proportion of all IT jobs advertised in the Midlands.
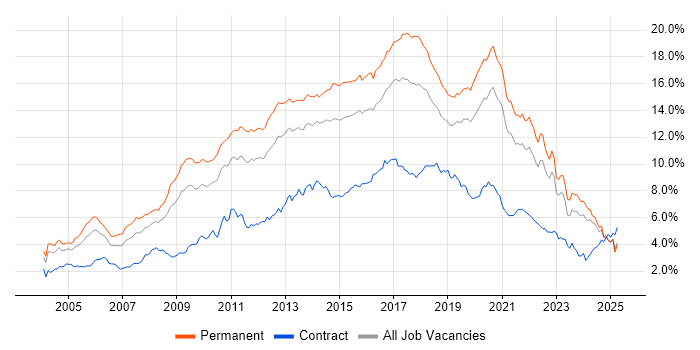
Job vacancy trend for JavaScript in the Midlands

JavaScript
Salary Trend in the Midlands

3-month moving average salary quoted in jobs citing JavaScript in the Midlands.

Salary trend for JavaScript in the Midlands

JavaScript
Salary Histogram in the Midlands

Salary distribution for jobs citing JavaScript in the Midlands over the 6 months to 26 October 2024.

Salary histogram for JavaScript in the Midlands

JavaScript
Job Locations in the Midlands

The table below looks at the demand and provides a guide to the median salaries quoted in IT jobs citing JavaScript within the Midlands region over the 6 months to 26 October 2024. The 'Rank Change' column provides an indication of the change in demand within each location based on the same 6 month period last year.

Location Rank Change
on Same Period
Last Year
Matching
Permanent
IT Job Ads
Median Salary
Past 6 Months
Median Salary
% Change
on Same Period
Last Year
Live
Jobs
West Midlands 0 343 £55,000 - 102
East Midlands -13 206 £47,500 -18.10% 74
JavaScript
England

JavaScript
Co-occurring Skills and Capabilities in the Midlands by Category

The follow tables expand on the table above by listing co-occurrences grouped by category. The same employment type, locality and period is covered with up to 20 co-occurrences shown in each of the following categories:

Application Platforms
1 25 (4.55%) WordPress
2 20 (3.64%) CMS
3 9 (1.64%) IIS
4 8 (1.45%) SharePoint
5 6 (1.09%) Confluence
5 6 (1.09%) Umbraco
6 5 (0.91%) Headless CMS
7 4 (0.73%) Apache
8 3 (0.55%) Microsoft Exchange
9 1 (0.18%) NServiceBus
9 1 (0.18%) Sitecore CMS
9 1 (0.18%) Strapi
Applications
1 8 (1.45%) Microsoft Office
2 6 (1.09%) Adobe XD
3 4 (0.73%) Adobe Illustrator
4 3 (0.55%) Trello
5 2 (0.36%) Adobe Creative Suite
5 2 (0.36%) Microsoft Excel
5 2 (0.36%) Microsoft PowerPoint
5 2 (0.36%) Photoshop
5 2 (0.36%) Sketch
6 1 (0.18%) Chatbot
6 1 (0.18%) InDesign
6 1 (0.18%) InfoPath
6 1 (0.18%) MS Visio
Business Applications
1 39 (7.09%) Dynamics CRM
2 6 (1.09%) Magento
3 4 (0.73%) NetSuite
3 4 (0.73%) Shopify
4 2 (0.36%) Payment Gateway
5 1 (0.18%) Sage X3
5 1 (0.18%) Salesforce CRM
5 1 (0.18%) SAP ERP
5 1 (0.18%) TRIRIGA
5 1 (0.18%) WebTrends
Cloud Services
1 160 (29.09%) Azure
2 98 (17.82%) AWS
3 72 (13.09%) GitHub
4 48 (8.73%) Azure DevOps
5 44 (8.00%) Power Platform
5 44 (8.00%) SaaS
6 42 (7.64%) Dynamics 365
7 24 (4.36%) GCP
7 24 (4.36%) Microsoft 365
8 23 (4.18%) Power Automate
9 18 (3.27%) Serverless
10 15 (2.73%) MailChimp
10 15 (2.73%) PaaS
11 13 (2.36%) PowerApps
12 8 (1.45%) Amazon S3
12 8 (1.45%) Google Workspace
13 7 (1.27%) Figma
13 7 (1.27%) IBM Cloud
14 6 (1.09%) Amazon EKS
14 6 (1.09%) Azure Logic Apps
Communications & Networking
1 10 (1.82%) Internet
2 5 (0.91%) HTTP
3 4 (0.73%) SMTP
3 4 (0.73%) SNMP
4 2 (0.36%) Broadband
4 2 (0.36%) MQTT
4 2 (0.36%) TCP/IP
4 2 (0.36%) Wireshark
5 1 (0.18%) FTP
5 1 (0.18%) HTTPS
5 1 (0.18%) RTSP
5 1 (0.18%) Wi-Fi
Database & Business Intelligence
1 71 (12.91%) SQL Server
2 32 (5.82%) MySQL
2 32 (5.82%) PostgreSQL
3 27 (4.91%) NoSQL
4 26 (4.73%) MongoDB
5 17 (3.09%) Relational Database
6 14 (2.55%) DB2
7 7 (1.27%) Power BI
8 5 (0.91%) Elasticsearch
8 5 (0.91%) SQL Server Reporting Services
9 4 (0.73%) Redis
10 3 (0.55%) SQL Server Integration Services
10 3 (0.55%) SQLite
11 2 (0.36%) DynamoDB
11 2 (0.36%) Tableau
12 1 (0.18%) Amazon RDS
12 1 (0.18%) BigQuery
12 1 (0.18%) KNIME
12 1 (0.18%) Looker
12 1 (0.18%) MariaDB
Development Applications
1 47 (8.55%) Git
2 18 (3.27%) Jenkins
3 17 (3.09%) GitLab
4 16 (2.91%) Visual Studio
5 15 (2.73%) JIRA
6 11 (2.00%) Visual Studio Code
7 8 (1.45%) Team Foundation Server
8 6 (1.09%) Cucumber
9 5 (0.91%) Cypress.io
10 4 (0.73%) Android Studio
10 4 (0.73%) Bitbucket
11 3 (0.55%) Selenium
11 3 (0.55%) Subversion
12 2 (0.36%) Eclipse
12 2 (0.36%) Fiddler
12 2 (0.36%) Gatling
12 2 (0.36%) JMeter
12 2 (0.36%) REST Assured
12 2 (0.36%) Visual Studio Team System
12 2 (0.36%) Xcode
General
1 119 (21.64%) Social Skills
2 64 (11.64%) Multimedia
3 57 (10.36%) Marketing
4 32 (5.82%) Analytical Skills
5 29 (5.27%) Public Sector
6 28 (5.09%) Finance
7 27 (4.91%) Law
8 23 (4.18%) Games
9 17 (3.09%) Retail
10 13 (2.36%) Inclusion and Diversity
11 11 (2.00%) Automotive
12 7 (1.27%) Advertising
13 6 (1.09%) Legal
13 6 (1.09%) Manufacturing
14 5 (0.91%) Electronics
14 5 (0.91%) Tech for Good
15 3 (0.55%) Telecoms
16 2 (0.36%) Documentation Skills
16 2 (0.36%) iGaming
16 2 (0.36%) Local Government
Job Titles
1 374 (68.00%) Developer
2 110 (20.00%) Senior
3 90 (16.36%) Web Developer
4 79 (14.36%) Senior Developer
5 76 (13.82%) .NET Developer
6 63 (11.45%) Trainee Developer
6 63 (11.45%) Trainee Web Developer
7 57 (10.36%) Full-Stack Developer
7 57 (10.36%) Lead
8 47 (8.55%) Software Engineer
9 42 (7.64%) C# Developer
10 32 (5.82%) Front-End Developer (Client-Side Developer)
11 31 (5.64%) Software Developer
12 24 (4.36%) Consultant
12 24 (4.36%) PHP Developer
13 22 (4.00%) Senior .NET Developer
14 21 (3.82%) C# .NET Developer
15 20 (3.64%) Lead Developer
16 18 (3.27%) JavaScript Developer
17 17 (3.09%) Senior Software Engineer
Libraries, Frameworks & Software Standards
1 302 (54.91%) HTML
2 279 (50.73%) CSS
3 191 (34.73%) .NET
4 147 (26.73%) React
5 109 (19.82%) AngularJS
6 93 (16.91%) HTML5
7 84 (15.27%) Node.js
8 83 (15.09%) CSS3
9 69 (12.55%) .NET Framework
10 67 (12.18%) Vue
11 60 (10.91%) ASP.NET
12 50 (9.09%) RESTful
13 41 (7.45%) Laravel
14 37 (6.73%) .NET Core
14 37 (6.73%) REST
15 36 (6.55%) jQuery
15 36 (6.55%) JSON
16 35 (6.36%) ASP.NET Web API
17 34 (6.18%) Web Services
18 28 (5.09%) XML
Miscellaneous
1 26 (4.73%) Self-Motivation
2 24 (4.36%) Mobile App
3 18 (3.27%) e-Learning
3 18 (3.27%) Legacy Code
4 16 (2.91%) Low-Code
5 13 (2.36%) Greenfield Project
6 12 (2.18%) Augmented Reality
6 12 (2.18%) Enterprise Software
6 12 (2.18%) Virtual Reality
7 10 (1.82%) Algorithms
7 10 (1.82%) Product Ownership
8 8 (1.45%) CMDB
8 8 (1.45%) Data Structures
9 7 (1.27%) Blockchain
9 7 (1.27%) Hybrid Cloud
9 7 (1.27%) iSeries
9 7 (1.27%) Legacy Systems
9 7 (1.27%) Social Media
10 4 (0.73%) Digital Media
10 4 (0.73%) Virtual Team
Operating Systems
1 32 (5.82%) Linux
1 32 (5.82%) Windows
2 17 (3.09%) Android
3 14 (2.55%) Apple iOS
4 8 (1.45%) Windows Server
5 4 (0.73%) VMS
6 2 (0.36%) Ubuntu
7 1 (0.18%) Unix
Processes & Methodologies
1 226 (41.09%) Full-Stack Development
2 139 (25.27%) Web Development
3 135 (24.55%) Agile
4 113 (20.55%) Problem-Solving
5 107 (19.45%) Software Engineering
6 93 (16.91%) DevOps
7 68 (12.36%) Front End Development
8 67 (12.18%) MVC
9 63 (11.45%) CI/CD
9 63 (11.45%) Mentoring
10 54 (9.82%) User Experience
11 52 (9.45%) Microservices
12 51 (9.27%) CRM
13 48 (8.73%) Coaching
14 41 (7.45%) OO
14 41 (7.45%) Test Automation
15 36 (6.55%) UX Design
16 32 (5.82%) OOP
17 31 (5.64%) Computer Science
18 28 (5.09%) Artificial Intelligence
Programming Languages
1 193 (35.09%) C#
2 160 (29.09%) SQL
3 123 (22.36%) Python
4 102 (18.55%) TypeScript
5 77 (14.00%) PHP
6 36 (6.55%) Java
7 23 (4.18%) C++
8 11 (2.00%) C
9 10 (1.82%) PowerShell
9 10 (1.82%) T-SQL
10 9 (1.64%) RPG
11 8 (1.45%) Assembly Language
11 8 (1.45%) RPG IV
11 8 (1.45%) VB.NET
12 5 (0.91%) Go
12 5 (0.91%) Shell Script
12 5 (0.91%) VB
13 4 (0.73%) Perl
13 4 (0.73%) R
14 3 (0.55%) Kotlin
Qualifications
1 60 (10.91%) Degree
2 21 (3.82%) Computer Science Degree
3 13 (2.36%) SC Cleared
3 13 (2.36%) Security Cleared
4 9 (1.64%) DV Cleared
5 6 (1.09%) Master's Degree
6 4 (0.73%) ITIL Foundation Certificate
7 2 (0.36%) MCSA
7 2 (0.36%) Microsoft Certification
8 1 (0.18%) AWS Certification
8 1 (0.18%) Azure Certification
8 1 (0.18%) ISTQB
Quality Assurance & Compliance
1 14 (2.55%) PMO
2 11 (2.00%) Accessibility
3 10 (1.82%) QA
4 5 (0.91%) GDPR
5 4 (0.73%) WCAG
6 3 (0.55%) WAI
7 2 (0.36%) ISO/IEC 27001
8 1 (0.18%) GRC
System Software
1 64 (11.64%) Docker
2 4 (0.73%) VMware Infrastructure
Systems Management
1 44 (8.00%) Kubernetes
2 16 (2.91%) Terraform
3 4 (0.73%) Single Sign-On
4 1 (0.18%) Ansible
Vendors
1 83 (15.09%) Microsoft
2 20 (3.64%) Google
3 17 (3.09%) IBM
4 15 (2.73%) Adobe
5 14 (2.55%) ServiceNow
6 7 (1.27%) Red Hat
7 4 (0.73%) OpenAI
7 4 (0.73%) Oracle
7 4 (0.73%) VMware
8 3 (0.55%) Facebook
8 3 (0.55%) SAP
8 3 (0.55%) WooCommerce
8 3 (0.55%) Zend
9 2 (0.36%) Liquidlogic
9 2 (0.36%) Salesforce
9 2 (0.36%) Telerik
9 2 (0.36%) Wrike
9 2 (0.36%) Xamarin
9 2 (0.36%) YouTube
9 2 (0.36%) Zoho