DevOps Jobs in the Midlands

DevOps
England > Midlands

The following table provides summary statistics for permanent job vacancies advertised in the Midlands with a requirement for DevOps skills. Included is a benchmarking guide to the salaries offered in vacancies that have cited DevOps over the 6 months to 6 December 2023 with a comparison to the same period in the previous 2 years.

6 months to
6 Dec 2023
Same period 2022 Same period 2021
Rank 13 12 13
Rank change year-on-year -1 +1 -1
Permanent jobs citing DevOps 563 1,546 1,369
As % of all permanent jobs advertised in the Midlands 11.11% 13.78% 12.75%
As % of the Processes & Methodologies category 11.95% 14.32% 13.44%
Number of salaries quoted 463 693 1,070
10th Percentile £38,800 £41,250 £37,500
25th Percentile £48,750 £47,500 £46,063
Median annual salary (50th Percentile) £60,000 £62,500 £60,000
Median % change year-on-year -4.00% +4.17% +14.29%
75th Percentile £70,000 £77,500 £75,000
90th Percentile £86,250 £87,500 £90,000
England median annual salary £70,000 £70,000 £70,000
% change year-on-year - - +12.00%

All Process and Methodology Skills
Midlands

DevOps is in the Processes and Methodologies category. The following table is for comparison with the above and provides summary statistics for all permanent job vacancies advertised in the Midlands with a requirement for process or methodology skills.

Permanent vacancies with a requirement for process or methodology skills 4,710 10,794 10,188
As % of all permanent jobs advertised in the Midlands 92.97% 96.21% 94.91%
Number of salaries quoted 3,519 6,132 7,363
10th Percentile £26,700 £30,915 £29,500
25th Percentile £36,459 £40,000 £37,066
Median annual salary (50th Percentile) £50,000 £52,500 £50,000
Median % change year-on-year -4.76% +5.00% +6.38%
75th Percentile £63,750 £66,250 £65,000
90th Percentile £77,500 £80,000 £78,750
England median annual salary £60,000 £62,500 £60,000
% change year-on-year -4.00% +4.17% +9.09%

DevOps
Job Vacancy Trend in the Midlands

Job postings citing DevOps as a proportion of all IT jobs advertised in the Midlands.
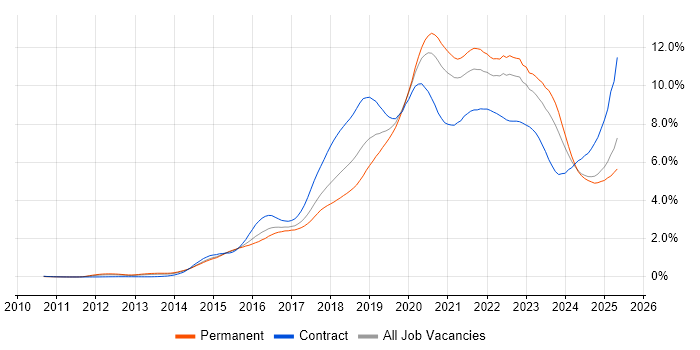
Job vacancy trend for DevOps in the Midlands

DevOps
Salary Trend in the Midlands

3-month moving average salary quoted in jobs citing DevOps in the Midlands.

Salary trend for DevOps in the Midlands

DevOps
Salary Histogram in the Midlands

Salary distribution for jobs citing DevOps in the Midlands over the 6 months to 6 December 2023.

Salary histogram for DevOps in the Midlands

DevOps
Job Locations in the Midlands

The table below looks at the demand and provides a guide to the median salaries quoted in IT jobs citing DevOps within the Midlands region over the 6 months to 6 December 2023. The 'Rank Change' column provides an indication of the change in demand within each location based on the same 6 month period last year.

Location Rank Change
on Same Period
Last Year
Matching
Permanent
IT Job Ads
Median Salary
Past 6 Months
Median Salary
% Change
on Same Period
Last Year
Live
Jobs
West Midlands -5 305 £60,000 -4.00% 126
East Midlands +7 260 £62,500 - 55
DevOps
England

DevOps
Co-occurring Skills and Capabilities in the Midlands by Category

The follow tables expand on the table above by listing co-occurrences grouped by category. The same employment type, locality and period is covered with up to 20 co-occurrences shown in each of the following categories:

Application Platforms
1 30 (5.33%) SharePoint
2 21 (3.73%) Confluence
3 6 (1.07%) MS Exchange
4 4 (0.71%) Apache Spark
4 4 (0.71%) Appian
4 4 (0.71%) IIS
5 2 (0.36%) JBoss
5 2 (0.36%) Oracle SOA Suite
6 1 (0.18%) Apache Airflow
6 1 (0.18%) Apache Solr
6 1 (0.18%) BizTalk Server
6 1 (0.18%) Jupyter
6 1 (0.18%) nginx
6 1 (0.18%) NServiceBus
6 1 (0.18%) WebSphere
6 1 (0.18%) WebSphere Application Server
Applications
1 7 (1.24%) Microsoft Excel
2 4 (0.71%) Microsoft Office
2 4 (0.71%) Microsoft PowerPoint
3 2 (0.36%) Trello
4 1 (0.18%) CANalyzer
4 1 (0.18%) MS Visio
4 1 (0.18%) Simulink
Business Applications
1 14 (2.49%) Dynamics CRM
2 4 (0.71%) Dynamics GP
2 4 (0.71%) Unit4 Business World
3 1 (0.18%) SAP S/4HANA
Cloud Services
1 381 (67.67%) Azure
2 213 (37.83%) Azure DevOps
3 139 (24.69%) AWS
4 69 (12.26%) Power Platform
5 61 (10.83%) GCP
6 52 (9.24%) Dynamics 365
7 42 (7.46%) Serverless
8 41 (7.28%) Microsoft 365
9 37 (6.57%) SaaS
10 34 (6.04%) Cloud Computing
11 28 (4.97%) GitHub
12 22 (3.91%) Azure Logic Apps
12 22 (3.91%) PowerApps
13 21 (3.73%) Azure Functions
13 21 (3.73%) PaaS
14 16 (2.84%) IaaS
15 14 (2.49%) Power Automate
16 12 (2.13%) AWS CloudFormation
16 12 (2.13%) Azure Data Factory
16 12 (2.13%) Azure Synapse Analytics
Communications & Networking
1 17 (3.02%) Firewall
2 12 (2.13%) Network Security
3 11 (1.95%) HTTP
4 10 (1.78%) VPN
5 9 (1.60%) DNS
5 9 (1.60%) Intrusion Detection
5 9 (1.60%) TCP/IP
6 7 (1.24%) SMTP
7 6 (1.07%) Internet
8 5 (0.89%) DHCP
8 5 (0.89%) F5 BIG-IP GTM
8 5 (0.89%) F5 BIG-IP LTM
9 4 (0.71%) FTP
10 3 (0.53%) LAN
10 3 (0.53%) NGFW
10 3 (0.53%) WAN
11 2 (0.36%) Extranet
11 2 (0.36%) Intranet
11 2 (0.36%) IPv4
11 2 (0.36%) MQTT
Database & Business Intelligence
1 94 (16.70%) SQL Server
2 40 (7.10%) Power BI
3 30 (5.33%) NoSQL
4 25 (4.44%) Relational Database
5 19 (3.37%) PostgreSQL
6 16 (2.84%) Azure SQL Database
7 15 (2.66%) Big Data
7 15 (2.66%) SQL Server Reporting Services
8 14 (2.49%) MongoDB
8 14 (2.49%) MySQL
9 13 (2.31%) Data Warehouse
10 12 (2.13%) Elasticsearch
10 12 (2.13%) SQL Server Integration Services
11 10 (1.78%) Delta Lake
11 10 (1.78%) Oracle Database
11 10 (1.78%) RDBMS
12 9 (1.60%) Neo4j
12 9 (1.60%) Parquet
13 5 (0.89%) Apache Cassandra
14 3 (0.53%) Hadoop
Development Applications
1 92 (16.34%) Git
2 36 (6.39%) Jenkins
3 32 (5.68%) JIRA
4 18 (3.20%) Visual Studio
5 16 (2.84%) GitLab
6 11 (1.95%) Team Foundation Server
7 10 (1.78%) Postman
8 7 (1.24%) MSTest
8 7 (1.24%) NUnit
8 7 (1.24%) Rational DOORS
9 6 (1.07%) Selenium
10 4 (0.71%) Bitbucket
10 4 (0.71%) Oracle APEX
10 4 (0.71%) Terragrunt
11 3 (0.53%) JDeveloper
11 3 (0.53%) SoapUI
11 3 (0.53%) TeamCity
11 3 (0.53%) VectorCAST
12 2 (0.36%) JMeter
12 2 (0.36%) Subversion
General
1 148 (26.29%) Social Skills
2 98 (17.41%) Finance
3 47 (8.35%) Analytical Skills
4 35 (6.22%) Law
5 30 (5.33%) Presentation Skills
6 27 (4.80%) Retail
7 21 (3.73%) Public Sector
8 14 (2.49%) Influencing Skills
8 14 (2.49%) Telecoms
9 12 (2.13%) Manufacturing
9 12 (2.13%) Tech for Good
10 11 (1.95%) Electronics
11 9 (1.60%) Inclusion and Diversity
12 8 (1.42%) Automotive
12 8 (1.42%) Banking
13 7 (1.24%) Legal
13 7 (1.24%) Marketing
14 6 (1.07%) Back Office
15 5 (0.89%) Billing
16 4 (0.71%) Games
Job Titles
1 159 (28.24%) Developer
2 109 (19.36%) Senior
3 63 (11.19%) Lead
4 60 (10.66%) DevOps Engineer
5 50 (8.88%) Cloud Engineer
6 46 (8.17%) Architect
6 46 (8.17%) Azure Engineer
6 46 (8.17%) Software Engineer
7 43 (7.64%) .NET Developer
8 36 (6.39%) Senior Developer
9 35 (6.22%) Software Developer
10 28 (4.97%) Solutions Architect
11 27 (4.80%) Lead Developer
12 26 (4.62%) Full Stack Developer
13 25 (4.44%) Senior DevOps
14 24 (4.26%) C# Developer
15 23 (4.09%) Azure DevOps Engineer
16 22 (3.91%) Data Engineer
17 21 (3.73%) Analyst
18 16 (2.84%) Senior .NET Developer
Libraries, Frameworks & Software Standards
1 155 (27.53%) .NET
2 72 (12.79%) .NET Framework
3 70 (12.43%) React
4 64 (11.37%) HTML
5 63 (11.19%) CSS
6 51 (9.06%) .NET Core
7 50 (8.88%) AngularJS
8 48 (8.53%) Node.js
9 46 (8.17%) ASP.NET
10 44 (7.82%) Entity Framework
10 44 (7.82%) jQuery
11 34 (6.04%) Web Services
12 33 (5.86%) REST
13 30 (5.33%) RESTful
14 29 (5.15%) JSON
15 27 (4.80%) ASP.NET MVC
16 22 (3.91%) ASP.NET Web API
17 21 (3.73%) Twitter Bootstrap
18 19 (3.37%) YAML
19 15 (2.66%) SOAP
Miscellaneous
1 33 (5.86%) Product Ownership
2 26 (4.62%) Management Information System
3 20 (3.55%) Data Centre
3 20 (3.55%) Greenfield Project
4 15 (2.66%) Public Cloud
5 14 (2.49%) Cloud Native
5 14 (2.49%) Hybrid Cloud
6 13 (2.31%) Self-Motivation
7 12 (2.13%) Virtual Team
8 10 (1.78%) Enterprise Software
8 10 (1.78%) Low-Code
9 9 (1.60%) Educational Technology
9 9 (1.60%) EPoS
9 9 (1.60%) Mobile App
10 8 (1.42%) Distributed Systems
11 7 (1.24%) Private Cloud
12 6 (1.07%) Enterprise Cloud
12 6 (1.07%) Onboarding
13 4 (0.71%) Verilog
13 4 (0.71%) VHDL
Operating Systems
1 44 (7.82%) Linux
2 32 (5.68%) Windows
3 19 (3.37%) Unix
4 9 (1.60%) Android
5 7 (1.24%) Windows Server
6 5 (0.89%) Apple iOS
7 3 (0.53%) Windows Server 2019
8 2 (0.36%) QNX Neutrino
8 2 (0.36%) Red Hat Enterprise Linux
9 1 (0.18%) Debian
9 1 (0.18%) Ubuntu
Processes & Methodologies
1 267 (47.42%) Agile
2 169 (30.02%) CI/CD
3 108 (19.18%) Software Engineering
4 99 (17.58%) Problem-Solving
5 86 (15.28%) Mentoring
6 83 (14.74%) Scrum
7 80 (14.21%) Microservices
8 72 (12.79%) Infrastructure as Code
9 71 (12.61%) Containerisation
10 70 (12.43%) MVC
11 64 (11.37%) Test Automation
12 62 (11.01%) Design Patterns
13 59 (10.48%) Coaching
14 54 (9.59%) TDD
15 51 (9.06%) Continuous Integration
16 50 (8.88%) Full Stack Development
16 50 (8.88%) SDLC
17 48 (8.53%) Actionable Insight
18 45 (7.99%) Business Intelligence
19 42 (7.46%) User Stories
Programming Languages
1 171 (30.37%) SQL
2 149 (26.47%) C#
3 135 (23.98%) JavaScript
4 94 (16.70%) Python
5 84 (14.92%) PowerShell
6 49 (8.70%) T-SQL
7 46 (8.17%) Java
7 46 (8.17%) TypeScript
8 37 (6.57%) Bash
9 27 (4.80%) Go
10 20 (3.55%) Ruby
11 14 (2.49%) Perl
12 12 (2.13%) Bicep
12 12 (2.13%) C++
13 8 (1.42%) C
14 7 (1.24%) PHP
14 7 (1.24%) VB.NET
15 4 (0.71%) XAML
16 3 (0.53%) Ada
16 3 (0.53%) MATLAB
Qualifications
1 77 (13.68%) Degree
2 61 (10.83%) Security Cleared
3 58 (10.30%) SC Cleared
4 22 (3.91%) Computer Science Degree
5 21 (3.73%) Azure Certification
6 13 (2.31%) Microsoft Certification
7 9 (1.60%) Chartered Engineer
7 9 (1.60%) HND
7 9 (1.60%) Master's Degree
8 8 (1.42%) TOGAF Certification
9 6 (1.07%) ISTQB
10 4 (0.71%) Cisco Certification
10 4 (0.71%) ISEB
11 3 (0.53%) IIBA
11 3 (0.53%) ITIL Certification
11 3 (0.53%) MCSE
12 2 (0.36%) AWS Certification
12 2 (0.36%) PRINCE2 Certification
12 2 (0.36%) VMware Certified Professional (VCP)
13 1 (0.18%) ISTQB Foundation Certification
Quality Assurance & Compliance
1 32 (5.68%) QA
2 8 (1.42%) NCSC
2 8 (1.42%) PMO
3 5 (0.89%) DO-178B
3 5 (0.89%) IEC 61508
4 3 (0.53%) AUTOSAR
4 3 (0.53%) PCI DSS
5 2 (0.36%) California Consumer Privacy Act
5 2 (0.36%) GDPR
5 2 (0.36%) HIPAA
5 2 (0.36%) IFRS
5 2 (0.36%) IFRS 17
5 2 (0.36%) Sarbanes-Oxley
5 2 (0.36%) SLA
5 2 (0.36%) Solvency II
6 1 (0.18%) Automotive SPICE
6 1 (0.18%) ISO 26262
6 1 (0.18%) NIST
System Software
1 99 (17.58%) Docker
2 26 (4.62%) Active Directory
3 9 (1.60%) Firmware
4 7 (1.24%) VMware Infrastructure
5 4 (0.71%) FreeRADIUS
5 4 (0.71%) Virtual Machines
6 3 (0.53%) Hyper-V
6 3 (0.53%) Virtual Desktop
6 3 (0.53%) VMware ESXi
6 3 (0.53%) vSphere
7 2 (0.36%) Ceph
7 2 (0.36%) NFS
Systems Management
1 116 (20.60%) Terraform
2 93 (16.52%) Kubernetes
3 31 (5.51%) Ansible
4 22 (3.91%) Puppet
5 11 (1.95%) Progress Chef
6 3 (0.53%) Grafana
6 3 (0.53%) Microsoft Intune
6 3 (0.53%) Prometheus
6 3 (0.53%) SCCM
6 3 (0.53%) Single Sign-On
7 2 (0.36%) Cisco CUCM
7 2 (0.36%) Hadoop YARN
7 2 (0.36%) Mesos
8 1 (0.18%) Rancher
8 1 (0.18%) SCOrch
Vendors
1 165 (29.31%) Microsoft
2 19 (3.37%) Google
3 18 (3.20%) Oracle
3 18 (3.20%) ServiceNow
4 17 (3.02%) Databricks
5 14 (2.49%) VMware
6 10 (1.78%) Cisco
7 8 (1.42%) Citrix
8 6 (1.07%) F5
8 6 (1.07%) Xamarin
9 5 (0.89%) CheckPoint
9 5 (0.89%) Fortinet
9 5 (0.89%) Salesforce
10 4 (0.71%) Guidewire
10 4 (0.71%) Mentor Graphics
10 4 (0.71%) Red Hat
10 4 (0.71%) Remedy
10 4 (0.71%) Xilinx
11 3 (0.53%) MuleSoft
11 3 (0.53%) New Relic