Security Cleared Jobs in the Midlands

Security Clearance
England > Midlands

The following table provides summary statistics for permanent job vacancies advertised in the Midlands with a requirement for Security Cleared qualifications. Included is a benchmarking guide to the salaries offered over the 6 months to 6 December 2023 with a comparison to the same period in the previous 2 years.

6 months to
6 Dec 2023
Same period 2022 Same period 2021
Rank 18 74 46
Rank change year-on-year +56 -28 +26
Permanent jobs citing Security Cleared 463 456 570
As % of all permanent jobs advertised in the Midlands 9.14% 4.06% 5.31%
As % of the Qualifications category 29.30% 11.56% 20.75%
Number of salaries quoted 291 295 269
10th Percentile £31,250 £23,500 £37,066
25th Percentile £43,000 £38,966 £46,250
Median annual salary (50th Percentile) £55,000 £55,000 £60,000
Median % change year-on-year - -8.33% +9.09%
75th Percentile £65,125 £66,875 £72,500
90th Percentile £72,500 £78,750 £85,000
England median annual salary £57,500 £55,000 £60,000
% change year-on-year +4.55% -8.33% +9.09%

All Academic and Professional Certifications
Midlands

Security Cleared is in the Academic Qualifications and Professional Certifications category. The following table is for comparison with the above and provides summary statistics for all permanent job vacancies advertised in the Midlands with a requirement for academic qualifications or professional certifications.

Permanent vacancies requiring academic qualifications or professional certifications 1,580 3,943 2,747
As % of all permanent jobs advertised in the Midlands 31.19% 35.15% 25.59%
Number of salaries quoted 1,118 1,790 1,641
10th Percentile £28,500 £28,000 £26,250
25th Percentile £37,500 £37,075 £35,750
Median annual salary (50th Percentile) £50,000 £47,500 £47,500
Median % change year-on-year +5.26% - +5.56%
75th Percentile £62,500 £61,250 £63,750
90th Percentile £72,500 £76,600 £73,750
England median annual salary £57,500 £56,480 £55,000
% change year-on-year +1.81% +2.69% -

Security Cleared
Job Vacancy Trend in the Midlands

Job postings citing Security Cleared as a proportion of all IT jobs advertised in the Midlands.
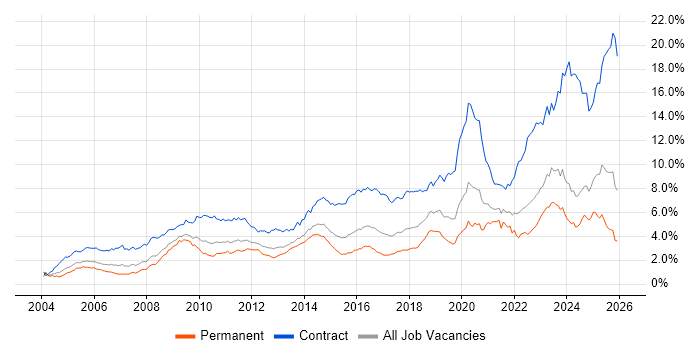
Job vacancy trend for Security Cleared in the Midlands

Security Cleared
Salary Trend in the Midlands

3-month moving average salary quoted in jobs citing Security Cleared in the Midlands.

Salary trend for Security Cleared in the Midlands

Security Cleared
Salary Histogram in the Midlands

Salary distribution for jobs citing Security Cleared in the Midlands over the 6 months to 6 December 2023.

Salary histogram for Security Cleared in the Midlands

Security Cleared
Job Locations in the Midlands

The table below looks at the demand and provides a guide to the median salaries quoted in IT jobs citing Security Cleared within the Midlands region over the 6 months to 6 December 2023. The 'Rank Change' column provides an indication of the change in demand within each location based on the same 6 month period last year.

Location Rank Change
on Same Period
Last Year
Matching
Permanent
IT Job Ads
Median Salary
Past 6 Months
Median Salary
% Change
on Same Period
Last Year
Live
Jobs
West Midlands +54 291 £55,000 - 129
East Midlands +48 172 £60,000 +4.35% 45
Security Cleared
England

Security Cleared
Co-occurring Skills and Capabilities in the Midlands by Category

The follow tables expand on the table above by listing co-occurrences grouped by category. The same employment type, locality and period is covered with up to 20 co-occurrences shown in each of the following categories:

Application Platforms
1 26 (5.62%) IIS
2 9 (1.94%) MS Exchange
3 7 (1.51%) JBoss
3 7 (1.51%) Red Hat Fuse
3 7 (1.51%) SharePoint
4 4 (0.86%) OpenStack
5 3 (0.65%) Appian
6 2 (0.43%) Confluence
6 2 (0.43%) Skype for Business
7 1 (0.22%) nginx
7 1 (0.22%) WebLogic
7 1 (0.22%) WebSphere
7 1 (0.22%) WebSphere Application Server
Applications
1 29 (6.26%) Microsoft Excel
2 28 (6.05%) Microsoft PowerPoint
3 21 (4.54%) Microsoft Office
4 1 (0.22%) MS Visio
4 1 (0.22%) Simulink
Business Applications
1 2 (0.43%) SAP BPC
1 2 (0.43%) SAP FSCM
1 2 (0.43%) SAP MDG
1 2 (0.43%) SAP S/4HANA
2 1 (0.22%) Dynamics CRM
2 1 (0.22%) SAP MM
2 1 (0.22%) SAP SD
2 1 (0.22%) Sparx Enterprise Architect
Cloud Services
1 85 (18.36%) Azure
2 50 (10.80%) AWS
3 29 (6.26%) Cloud Computing
4 26 (5.62%) Microsoft 365
4 26 (5.62%) Serverless
5 22 (4.75%) GCP
6 15 (3.24%) Entra ID
7 14 (3.02%) Azure DevOps
8 9 (1.94%) IaaS
8 9 (1.94%) OneDrive
9 8 (1.73%) Power Platform
10 7 (1.51%) Azure Sentinel
11 6 (1.30%) dbt
11 6 (1.30%) SaaS
12 5 (1.08%) AWS Lambda
12 5 (1.08%) OpenShift
12 5 (1.08%) PaaS
12 5 (1.08%) PowerApps
13 2 (0.43%) AWS CloudFormation
13 2 (0.43%) Power Automate
Communications & Networking
1 72 (15.55%) Firewall
2 69 (14.90%) WAN
3 27 (5.83%) BGP
4 25 (5.40%) LAN
5 24 (5.18%) Network Security
6 23 (4.97%) OSPF
7 21 (4.54%) DNS
8 19 (4.10%) SD-WAN
9 16 (3.46%) Wireless
10 15 (3.24%) DHCP
11 14 (3.02%) HTTP
11 14 (3.02%) Intrusion Detection
11 14 (3.02%) VPN
12 13 (2.81%) Internet
13 10 (2.16%) MPLS
13 10 (2.16%) TCP/IP
14 9 (1.94%) SAN
15 8 (1.73%) Cisco Nexus
15 8 (1.73%) SMTP
15 8 (1.73%) VLAN
Database & Business Intelligence
1 33 (7.13%) SQL Server
2 20 (4.32%) NoSQL
3 14 (3.02%) PostgreSQL
4 10 (2.16%) MySQL
4 10 (2.16%) Relational Database
5 9 (1.94%) RDBMS
6 8 (1.73%) Big Data
7 7 (1.51%) GIS
7 7 (1.51%) Oracle Database
8 5 (1.08%) Amazon RDS
9 3 (0.65%) Elasticsearch
9 3 (0.65%) Oracle Reports
9 3 (0.65%) Power BI
10 2 (0.43%) Amazon Redshift
10 2 (0.43%) DynamoDB
10 2 (0.43%) JasperReports
10 2 (0.43%) MariaDB
10 2 (0.43%) MongoDB
10 2 (0.43%) Parquet
10 2 (0.43%) Redis
Development Applications
1 35 (7.56%) Git
2 14 (3.02%) Jenkins
3 7 (1.51%) IntelliJ
3 7 (1.51%) Rational DOORS
4 5 (1.08%) JIRA
5 4 (0.86%) GitLab
5 4 (0.86%) Selenium
6 2 (0.43%) eggPlant
6 2 (0.43%) IDA Disassembler
6 2 (0.43%) LSMW
6 2 (0.43%) Maven
6 2 (0.43%) Postman
6 2 (0.43%) VectorCAST
7 1 (0.22%) Cucumber
7 1 (0.22%) Cypress.io
7 1 (0.22%) JMeter
7 1 (0.22%) Oracle APEX
7 1 (0.22%) REST Assured
7 1 (0.22%) SoapUI
7 1 (0.22%) WebDriver
General
1 193 (41.68%) Social Skills
2 87 (18.79%) Public Sector
3 62 (13.39%) Finance
4 38 (8.21%) Banking
4 38 (8.21%) Games
5 35 (7.56%) Telecoms
6 30 (6.48%) Inclusion and Diversity
7 29 (6.26%) Presentation Skills
8 28 (6.05%) Analytical Skills
9 20 (4.32%) Organisational Skills
10 16 (3.46%) Police
11 15 (3.24%) Influencing Skills
11 15 (3.24%) Retail
12 14 (3.02%) Electronics
12 14 (3.02%) Manufacturing
13 11 (2.38%) Aerospace
14 10 (2.16%) Law
15 6 (1.30%) Marketing
16 2 (0.43%) General Ledger
16 2 (0.43%) Military
Job Titles
1 95 (20.52%) Architect
2 59 (12.74%) Senior
3 40 (8.64%) Security Architect
4 29 (6.26%) Systems Engineer
5 28 (6.05%) Software Engineer
6 26 (5.62%) Consultant
6 26 (5.62%) Network Engineer
6 26 (5.62%) Solutions Architect
7 22 (4.75%) Developer
8 20 (4.32%) Lead
8 20 (4.32%) Presales Solution Architect
9 18 (3.89%) Security Engineer
10 16 (3.46%) Infrastructure Engineer
10 16 (3.46%) Network Architect
11 15 (3.24%) Java Engineer
11 15 (3.24%) Project Manager
12 14 (3.02%) Business Development Manager
12 14 (3.02%) Business Manager
12 14 (3.02%) Development Manager
12 14 (3.02%) Java Software Engineer
Libraries, Frameworks & Software Standards
1 29 (6.26%) REST
2 21 (4.54%) JSON
3 19 (4.10%) Spring
4 18 (3.89%) Web Services
5 17 (3.67%) Node.js
6 15 (3.24%) React
7 14 (3.02%) .NET
7 14 (3.02%) WebRTC
7 14 (3.02%) XML
8 13 (2.81%) RESTful
9 10 (2.16%) SOAP
10 9 (1.94%) J2EE
10 9 (1.94%) Ruby on Rails
11 8 (1.73%) AngularJS
11 8 (1.73%) Twitter Bootstrap
11 8 (1.73%) YAML
12 7 (1.51%) Hibernate
12 7 (1.51%) JPA
12 7 (1.51%) XSD
13 5 (1.08%) CSS
Miscellaneous
1 42 (9.07%) Data Centre
2 40 (8.64%) Management Information System
3 34 (7.34%) Driving Licence
4 31 (6.70%) Clustering
5 21 (4.54%) Self-Motivation
6 16 (3.46%) Distributed Systems
6 16 (3.46%) Public Cloud
7 15 (3.24%) PKI
7 15 (3.24%) Virtual Team
8 8 (1.73%) IoT
9 6 (1.30%) FPGA
9 6 (1.30%) VHDL
10 5 (1.08%) Client/Server
10 5 (1.08%) Greenfield Project
10 5 (1.08%) Operational Technology
11 4 (0.86%) GNSS
11 4 (0.86%) Hybrid Cloud
11 4 (0.86%) Product Ownership
11 4 (0.86%) Security Operations Centre
11 4 (0.86%) Verilog
Operating Systems
1 63 (13.61%) Windows
2 29 (6.26%) Linux
3 22 (4.75%) Unix
4 16 (3.46%) Windows Server
5 15 (3.24%) Android
5 15 (3.24%) Apple iOS
6 9 (1.94%) Mac OS
7 8 (1.73%) Windows Server 2003
8 5 (1.08%) Windows 2000
9 3 (0.65%) Windows Server 2016
9 3 (0.65%) Windows Server 2019
10 1 (0.22%) Red Hat Enterprise Linux
10 1 (0.22%) Windows 10
10 1 (0.22%) Windows 7
10 1 (0.22%) Windows Server 2012
Processes & Methodologies
1 135 (29.16%) Problem-Solving
2 122 (26.35%) Actionable Insight
3 115 (24.84%) Cybersecurity
4 61 (13.17%) Agile
4 61 (13.17%) DevOps
5 57 (12.31%) Containerisation
6 54 (11.66%) SIEM
7 53 (11.45%) Software Engineering
8 50 (10.80%) Coaching
9 49 (10.58%) Mentoring
10 46 (9.94%) Asset Management
11 42 (9.07%) CI/CD
12 41 (8.86%) Continuous Integration
13 39 (8.42%) Identity Access Management
13 39 (8.42%) IT Asset Management
13 39 (8.42%) Vulnerability Management
14 38 (8.21%) Network Segmentation
14 38 (8.21%) RBAC
15 36 (7.78%) Design Patterns
16 33 (7.13%) Analytics
Programming Languages
1 60 (12.96%) Python
2 55 (11.88%) Java
2 55 (11.88%) SQL
3 25 (5.40%) PowerShell
4 22 (4.75%) Go
5 20 (4.32%) Ruby
6 19 (4.10%) C#
7 16 (3.46%) Bash
8 14 (3.02%) C
9 13 (2.81%) JavaScript
10 8 (1.73%) PHP
11 6 (1.30%) C++
12 5 (1.08%) Perl
13 3 (0.65%) Ada
13 3 (0.65%) Embedded C
14 2 (0.43%) Kusto Query Language
14 2 (0.43%) VB.NET
14 2 (0.43%) VBA
15 1 (0.22%) PL/SQL
15 1 (0.22%) TypeScript
Qualifications
1 320 (69.11%) SC Cleared
2 63 (13.61%) Degree
3 33 (7.13%) DV Cleared
4 28 (6.05%) Cisco Certification
5 22 (4.75%) CCNP
6 18 (3.89%) CCNA
7 15 (3.24%) CISSP
8 13 (2.81%) CTC Cleared
9 12 (2.59%) CompTIA Security+
10 9 (1.94%) BPSS Clearance
10 9 (1.94%) Chartered Engineer
10 9 (1.94%) HND
10 9 (1.94%) MCSE
10 9 (1.94%) Microsoft Certification
11 8 (1.73%) Computer Science Degree
12 7 (1.51%) TOGAF Certification
13 6 (1.30%) CREST Certified
13 6 (1.30%) PMI Certification
13 6 (1.30%) PMP
13 6 (1.30%) PRINCE2 Practitioner
Quality Assurance & Compliance
1 45 (9.72%) ISO/IEC 27001
2 26 (5.62%) ISO 9001
3 23 (4.97%) Cyber Essentials
4 20 (4.32%) ISO/IEC 17025
5 13 (2.81%) NCSC
6 12 (2.59%) QA
7 11 (2.38%) SLA
8 9 (1.94%) NIST
9 7 (1.51%) Disclosure Scotland
10 5 (1.08%) DO-178B
10 5 (1.08%) GRC
10 5 (1.08%) IEC 61508
10 5 (1.08%) ISO 22301
10 5 (1.08%) RMADS
11 3 (0.65%) COBIT
11 3 (0.65%) JSP 440
12 2 (0.43%) Cyber Essentials PLUS
12 2 (0.43%) Def Stans
12 2 (0.43%) Government Security Classifications
12 2 (0.43%) HMG Security Policy Framework
System Software
1 48 (10.37%) Active Directory
2 38 (8.21%) Virtual Machines
3 27 (5.83%) VMware Infrastructure
4 19 (4.10%) Firmware
5 13 (2.81%) Docker
5 13 (2.81%) VMware NSX
6 12 (2.59%) Hyper-V
7 11 (2.38%) VMware ESXi
8 5 (1.08%) vSphere
9 2 (0.43%) KVM
10 1 (0.22%) Terminal Services
10 1 (0.22%) Virtual Desktop
10 1 (0.22%) XenApp
10 1 (0.22%) XenDesktop
Systems Management
1 20 (4.32%) EnCase
2 17 (3.67%) Puppet
3 14 (3.02%) Microsoft Intune
3 14 (3.02%) SCCM
4 12 (2.59%) Terraform
5 11 (2.38%) Kubernetes
6 9 (1.94%) vCenter Server
7 8 (1.73%) Progress Chef
8 6 (1.30%) Cacti
8 6 (1.30%) Icinga
8 6 (1.30%) Nessus
9 5 (1.08%) AirWatch
9 5 (1.08%) McAfee ePO
9 5 (1.08%) Microsoft Clustering
10 4 (0.86%) Nagios
11 3 (0.65%) SCOM
12 1 (0.22%) Ansible
12 1 (0.22%) CSIRT
12 1 (0.22%) WSUS
12 1 (0.22%) ZABBIX
Vendors
1 88 (19.01%) Microsoft
2 54 (11.66%) VMware
3 42 (9.07%) Cisco
4 25 (5.40%) Juniper
5 18 (3.89%) ServiceNow
6 17 (3.67%) Aruba
6 17 (3.67%) CheckPoint
7 16 (3.46%) F5
7 16 (3.46%) Oracle
8 12 (2.59%) Fortinet
9 10 (2.16%) Citrix
9 10 (2.16%) Google
10 9 (1.94%) Remedy
10 9 (1.94%) SAP
11 8 (1.73%) Ericsson
12 7 (1.51%) Palo Alto
13 6 (1.30%) HP
13 6 (1.30%) SolarWinds
14 5 (1.08%) CA
14 5 (1.08%) Veritas