Linux Jobs in the Midlands

Linux
England > Midlands

The table below provides summary statistics for permanent job vacancies advertised in the Midlands requiring Linux skills. It includes a benchmarking guide to the annual salaries offered in vacancies that cited Linux over the 6 months leading up to 31 May 2025, comparing them to the same period in the previous two years.

6 months to
31 May 2025
Same period 2024 Same period 2023
Rank 81 48 73
Rank change year-on-year -33 +25 -40
Permanent jobs citing Linux 244 524 402
As % of all permanent jobs advertised in the Midlands 3.53% 4.07% 4.59%
As % of the Operating Systems category 26.84% 31.59% 32.01%
Number of salaries quoted 115 349 247
10th Percentile £27,600 £32,500 £38,507
25th Percentile £32,500 £38,750 £44,000
Median annual salary (50th Percentile) £47,500 £50,000 £55,000
Median % change year-on-year -5.00% -9.09% +4.76%
75th Percentile £62,500 £58,750 £67,500
90th Percentile £73,750 £68,750 £80,000
England median annual salary £60,000 £55,000 £64,140
% change year-on-year +9.09% -14.25% +6.90%

All Operating Systems
Midlands

Linux falls under the Operating Systems category. For comparison with the information above, the following table provides summary statistics for all permanent job vacancies requiring operating system skills in the Midlands.

Permanent vacancies with a requirement for operating system skills 909 1,659 1,256
As % of all permanent jobs advertised in the Midlands 13.15% 12.90% 14.35%
Number of salaries quoted 589 1,333 813
10th Percentile £26,250 £24,500 £25,100
25th Percentile £29,250 £27,500 £31,250
Median annual salary (50th Percentile) £36,925 £40,000 £45,000
Median % change year-on-year -7.69% -11.11% -
75th Percentile £48,750 £53,750 £57,500
90th Percentile £62,500 £62,500 £67,500
England median annual salary £45,000 £45,000 £52,500
% change year-on-year - -14.29% -

Linux
Job Vacancy Trend in the Midlands

Job postings citing Linux as a proportion of all IT jobs advertised in the Midlands.
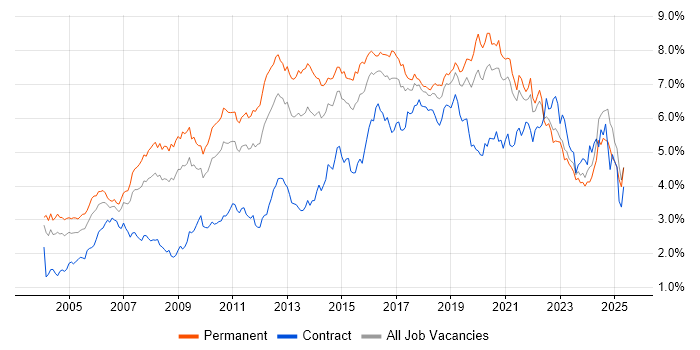
Job vacancy trend for Linux in the Midlands

Linux
Salary Trend in the Midlands

3-month moving average salary quoted in jobs citing Linux in the Midlands.

Salary trend for Linux in the Midlands

Linux
Salary Histogram in the Midlands

Salary distribution for jobs citing Linux in the Midlands over the 6 months to 31 May 2025.

Salary histogram for Linux in the Midlands

Linux
Job Locations in the Midlands

The table below looks at the demand and provides a guide to the median salaries quoted in IT jobs citing Linux within the Midlands region over the 6 months to 31 May 2025. The 'Rank Change' column provides an indication of the change in demand within each location based on the same 6 month period last year.

Location Rank Change
on Same Period
Last Year
Matching
Permanent
IT Job Ads
Median Salary
Past 6 Months
Median Salary
% Change
on Same Period
Last Year
Live
Jobs
West Midlands +16 156 £52,500 -2.78% 108
East Midlands -50 85 £40,101 -19.80% 50
Linux
England

Linux
Co-occurring Skills and Capabilities in the Midlands by Category

The follow tables expand on the table above by listing co-occurrences grouped by category. The same employment type, locality and period is covered with up to 20 co-occurrences shown in each of the following categories:

Application Platforms
1 49 (20.08%) Confluence
2 9 (3.69%) Microsoft Exchange
3 4 (1.64%) Apache Spark
4 3 (1.23%) nginx
5 2 (0.82%) Apache
5 2 (0.82%) IIS
5 2 (0.82%) Oracle SOA Suite
6 1 (0.41%) ColdFusion
6 1 (0.41%) OpenStack
Applications
1 17 (6.97%) Microsoft Office
2 11 (4.51%) Microsoft Excel
3 7 (2.87%) Mozilla Thunderbird
4 2 (0.82%) EngageOne
5 1 (0.41%) GNU Octave
5 1 (0.41%) Simulink
5 1 (0.41%) Trello
Business Applications
1 7 (2.87%) Oracle EBS
2 4 (1.64%) Oracle Applications
3 1 (0.41%) Oracle ERP
3 1 (0.41%) PeopleSoft HCM
Cloud Services
1 74 (30.33%) AWS
2 55 (22.54%) Azure
3 27 (11.07%) SaaS
4 26 (10.66%) Amazon S3
4 26 (10.66%) AWS KMS
5 25 (10.25%) Amazon CloudWatch
5 25 (10.25%) Amazon EC2
6 23 (9.43%) Microsoft 365
7 21 (8.61%) Virtual Private Cloud
8 20 (8.20%) Amazon ELB
9 17 (6.97%) Amazon Glacier
10 13 (5.33%) Google Workspace
11 10 (4.10%) PaaS
12 8 (3.28%) Amazon ECS
12 8 (3.28%) Route 53
13 6 (2.46%) Amazon SQS
14 5 (2.05%) AWS Lambda
14 5 (2.05%) Pulumi
14 5 (2.05%) Serverless
15 4 (1.64%) Amazon GuardDuty
Communications & Networking
1 44 (18.03%) Firewall
2 38 (15.57%) WLAN
3 34 (13.93%) TCP/IP
4 33 (13.52%) DNS
4 33 (13.52%) Network Security
5 31 (12.70%) VPN
6 29 (11.89%) Internet
7 21 (8.61%) DHCP
8 14 (5.74%) VLAN
9 11 (4.51%) BGP
9 11 (4.51%) OSPF
10 9 (3.69%) HTTP
11 8 (3.28%) Cisco IOS
11 8 (3.28%) FTP
11 8 (3.28%) SMTP
11 8 (3.28%) SSH
11 8 (3.28%) WAN
12 6 (2.46%) SSL
13 5 (2.05%) LAN
13 5 (2.05%) Wi-Fi
Database & Business Intelligence
1 35 (14.34%) MySQL
2 33 (13.52%) Relational Database
3 26 (10.66%) Amazon RDS
4 18 (7.38%) NoSQL
5 9 (3.69%) PostgreSQL
6 8 (3.28%) Amazon Aurora
6 8 (3.28%) Oracle Database
7 6 (2.46%) Elasticsearch
7 6 (2.46%) Oracle Exadata
8 5 (2.05%) DynamoDB
8 5 (2.05%) RDBMS
9 4 (1.64%) Big Data
9 4 (1.64%) SQL Server
10 2 (0.82%) MongoDB
11 1 (0.41%) DB2
11 1 (0.41%) Oracle Reports
11 1 (0.41%) Redis
Development Applications
1 55 (22.54%) Git
2 49 (20.08%) JIRA
3 29 (11.89%) Jenkins
4 27 (11.07%) Bitbucket
5 21 (8.61%) JUnit
5 21 (8.61%) Mockito
6 20 (8.20%) Vagrant
7 16 (6.56%) Cucumber
7 16 (6.56%) Eclipse
8 15 (6.15%) Robot Framework
9 14 (5.74%) IntelliJ
9 14 (5.74%) Jasmine
9 14 (5.74%) Karma Test Runner
9 14 (5.74%) Protractor
10 9 (3.69%) Bitbucket Server
11 7 (2.87%) Sonatype Nexus
12 6 (2.46%) Maven
13 5 (2.05%) DbUnit
13 5 (2.05%) GitLab
13 5 (2.05%) SonarQube
General
1 64 (26.23%) Social Skills
2 40 (16.39%) Inclusion and Diversity
3 26 (10.66%) Analytical Skills
4 18 (7.38%) Public Sector
5 17 (6.97%) Automotive
6 16 (6.56%) Telecoms
7 12 (4.92%) Retail
8 11 (4.51%) Law
9 6 (2.46%) Presentation Skills
10 5 (2.05%) Finance
10 5 (2.05%) Police
11 4 (1.64%) Electronics
12 2 (0.82%) Legal
12 2 (0.82%) Manufacturing
12 2 (0.82%) Organisational Skills
13 1 (0.41%) Advertising
13 1 (0.41%) Back Office
13 1 (0.41%) Games
13 1 (0.41%) Marketing
Job Titles
1 61 (25.00%) IT Engineer
2 46 (18.85%) IT Support
3 39 (15.98%) Support Engineer
4 37 (15.16%) Developer
5 31 (12.70%) Systems Engineer
6 29 (11.89%) IT Support Engineer
7 26 (10.66%) Java Developer
8 24 (9.84%) Senior
9 23 (9.43%) Infrastructure Engineer
10 18 (7.38%) Software Engineer
11 17 (6.97%) Lead
12 15 (6.15%) Test Automation Engineer
12 15 (6.15%) Test Engineer
13 14 (5.74%) SaaS Developer
14 13 (5.33%) DevOps Engineer
15 12 (4.92%) Backend Developer
16 11 (4.51%) Infrastructure Support
16 11 (4.51%) Senior Software Engineer
16 11 (4.51%) Team Leader
17 10 (4.10%) Linux Engineer
Libraries, Frameworks & Software Standards
1 34 (13.93%) .NET
2 24 (9.84%) JPA
3 23 (9.43%) AngularJS
4 19 (7.79%) Hibernate
5 18 (7.38%) React
6 15 (6.15%) RabbitMQ
7 14 (5.74%) Elastic Stack
7 14 (5.74%) Middleware
8 7 (2.87%) Oracle Fusion
8 7 (2.87%) Spring
9 6 (2.46%) Bootstrap
9 6 (2.46%) Oracle GoldenGate
9 6 (2.46%) RESTful
9 6 (2.46%) SOAP
9 6 (2.46%) Web Services
10 5 (2.05%) ActiveMQ
10 5 (2.05%) J2EE
10 5 (2.05%) Spring Batch
10 5 (2.05%) Spring Integration
10 5 (2.05%) Vaadin
Miscellaneous
1 46 (18.85%) Driving Licence
2 18 (7.38%) Linux Command Line
3 16 (6.56%) Management Information System
4 15 (6.15%) Algorithms
5 13 (5.33%) Replication
6 11 (4.51%) Cyberattack
6 11 (4.51%) Smartphone
7 9 (3.69%) Mobile App
8 5 (2.05%) Data Centre
9 4 (1.64%) IoT
10 3 (1.23%) Distributed Architecture
10 3 (1.23%) Distributed Systems
10 3 (1.23%) Embedded Systems
10 3 (1.23%) Hybrid Cloud
10 3 (1.23%) Self-Motivation
11 2 (0.82%) Analytical Mindset
11 2 (0.82%) Augmented Reality
11 2 (0.82%) Cloud Native
11 2 (0.82%) NB-IoT
11 2 (0.82%) Security Posture
Operating Systems
1 168 (68.85%) Windows
2 43 (17.62%) Windows Server
3 27 (11.07%) Ubuntu
4 20 (8.20%) VMS
5 16 (6.56%) Windows 10
6 15 (6.15%) Android
7 13 (5.33%) Windows Server 2016
7 13 (5.33%) Windows Server 2019
8 12 (4.92%) Mac OS X
8 12 (4.92%) Rocky
8 12 (4.92%) Unix
9 9 (3.69%) Amazon Linux
9 9 (3.69%) CentOS
10 8 (3.28%) Red Hat Enterprise Linux
11 5 (2.05%) Windows 7
12 4 (1.64%) Embedded Linux
13 3 (1.23%) Apple iOS
14 2 (0.82%) AIX
14 2 (0.82%) Debian
15 1 (0.41%) Oracle Linux
Processes & Methodologies
1 77 (31.56%) Agile
2 76 (31.15%) Problem-Solving
3 67 (27.46%) Mentoring
4 64 (26.23%) DevOps
5 51 (20.90%) Coaching
6 43 (17.62%) Computer Science
6 43 (17.62%) ITIL
7 41 (16.80%) Continuous Integration
8 39 (15.98%) CI/CD
9 38 (15.57%) Asset Management
10 32 (13.11%) Containerisation
11 29 (11.89%) Network Management
12 28 (11.48%) Systems Engineering
13 27 (11.07%) Continuous Deployment
13 27 (11.07%) DevSecOps
13 27 (11.07%) IT Asset Management
14 25 (10.25%) Configuration Management
15 24 (9.84%) Performance Tuning
16 23 (9.43%) Infrastructure Engineering
17 22 (9.02%) Software Engineering
Programming Languages
1 78 (31.97%) Python
2 60 (24.59%) PowerShell
3 55 (22.54%) SQL
4 48 (19.67%) Java
5 37 (15.16%) C#
6 35 (14.34%) Bash
7 30 (12.30%) JavaScript
8 19 (7.79%) Groovy
9 14 (5.74%) Shell Script
10 13 (5.33%) C++
11 11 (4.51%) Perl
12 8 (3.28%) PL/SQL
13 7 (2.87%) C
13 7 (2.87%) Go
14 6 (2.46%) Rust
14 6 (2.46%) TypeScript
15 3 (1.23%) PHP
15 3 (1.23%) Ruby
16 2 (0.82%) Ada
16 2 (0.82%) MATLAB
Qualifications
1 89 (36.48%) Degree
2 47 (19.26%) Microsoft Certification
3 46 (18.85%) MCSE
4 42 (17.21%) Computer Science Degree
4 42 (17.21%) Security Cleared
5 40 (16.39%) CCNA
5 40 (16.39%) Cisco Certification
6 35 (14.34%) CCNP
6 35 (14.34%) MCP
7 29 (11.89%) BPSS Clearance
8 28 (11.48%) SC Cleared
9 27 (11.07%) LPIC
10 12 (4.92%) DV Cleared
11 11 (4.51%) AWS Certification
11 11 (4.51%) HNC
11 11 (4.51%) HND
12 9 (3.69%) MCSA
13 6 (2.46%) Azure Certification
13 6 (2.46%) Network+ Certification
14 5 (2.05%) OCP
Quality Assurance & Compliance
1 18 (7.38%) QA
2 6 (2.46%) Accessibility
2 6 (2.46%) SLA
3 5 (2.05%) ISO/IEC 27001
4 4 (1.64%) Data Quality
5 3 (1.23%) Cyber Essentials
6 2 (0.82%) ISO 9000
7 1 (0.41%) GDPR
7 1 (0.41%) NCSC
7 1 (0.41%) NIST
7 1 (0.41%) PMO
System Software
1 60 (24.59%) Docker
2 45 (18.44%) Active Directory
3 15 (6.15%) VMware Infrastructure
4 13 (5.33%) DFS Replication
5 12 (4.92%) Hyper-V
6 10 (4.10%) vSphere
7 8 (3.28%) VMware NSX
8 5 (2.05%) Postfix
9 4 (1.64%) Virtual Desktop
9 4 (1.64%) Virtual Machines
10 3 (1.23%) Dovecot
10 3 (1.23%) LXC
10 3 (1.23%) Squid
11 1 (0.41%) Firmware
11 1 (0.41%) Xen
Systems Management
1 68 (27.87%) Ansible
2 47 (19.26%) Terraform
3 25 (10.25%) Prometheus
4 21 (8.61%) Grafana
5 11 (4.51%) Kubernetes
6 8 (3.28%) Nessus
7 7 (2.87%) Proxmox
8 6 (2.46%) Microsoft Intune
8 6 (2.46%) Oracle RMAN
9 5 (2.05%) Argo
9 5 (2.05%) Puppet
10 4 (1.64%) Kustomize
11 3 (1.23%) Nagios
12 2 (0.82%) Progress Chef
12 2 (0.82%) SCOM
13 1 (0.41%) AWS Copilot
13 1 (0.41%) FortiGate
13 1 (0.41%) Rancher
13 1 (0.41%) Single Sign-On
13 1 (0.41%) WSUS
Vendors
1 65 (26.64%) Microsoft
2 60 (24.59%) Cisco
3 32 (13.11%) Atlassian
4 25 (10.25%) Juniper
5 21 (8.61%) ServiceNow
6 20 (8.20%) Google
6 20 (8.20%) VMware
7 15 (6.15%) IBM
8 14 (5.74%) Apple
9 13 (5.33%) Red Hat
10 12 (4.92%) Dell
10 12 (4.92%) Ubiquiti
11 11 (4.51%) Fortinet
11 11 (4.51%) Oracle
12 10 (4.10%) Splunk
13 8 (3.28%) 3PAR
14 5 (2.05%) Jaspersoft
15 4 (1.64%) Databricks
16 3 (1.23%) Citrix
17 2 (0.82%) SevOne