Software Engineering Job Trends in the North of England

Software Engineering
England > North of England

The table below provides summary statistics and salary benchmarking for jobs advertised in the North of England requiring Software Engineering skills. It covers permanent job vacancies from the 6 months leading up to 27 November 2025, with comparisons to the same periods in the previous two years.

6 months to
27 Nov 2025
Same period 2024 Same period 2023
Rank 44 12 14
Rank change year-on-year -32 +2 -1
Permanent jobs citing Software Engineering 498 1,184 798
As % of all permanent jobs in the North of England 5.27% 9.72% 10.97%
As % of the Processes & Methodologies category 6.24% 11.65% 11.59%
Number of salaries quoted 398 588 592
10th Percentile £37,500 £40,000 £42,500
25th Percentile £51,250 £47,750 £48,750
Median annual salary (50th Percentile) £65,000 £57,500 £60,000
Median % change year-on-year +13.04% -4.17% -1.64%
75th Percentile £80,000 £70,000 £74,063
90th Percentile £96,625 £82,500 £83,750
England median annual salary £75,000 £70,000 £70,000
% change year-on-year +7.14% - -

All Process and Methodology Skills
North of England

Software Engineering falls under the Processes and Methodologies category. For comparison with the information above, the following table provides summary statistics for all permanent job vacancies requiring process or methodology skills in the North of England.

Permanent vacancies with a requirement for process or methodology skills 7,983 10,159 6,887
As % of all permanent jobs advertised in the North of England 84.41% 83.41% 94.67%
Number of salaries quoted 4,598 4,815 5,196
10th Percentile £26,500 £31,250 £29,750
25th Percentile £31,250 £40,000 £40,500
Median annual salary (50th Percentile) £48,750 £51,000 £55,000
Median % change year-on-year -4.41% -7.27% +4.76%
75th Percentile £65,000 £66,250 £68,750
90th Percentile £80,000 £80,000 £83,750
England median annual salary £55,000 £60,000 £60,000
% change year-on-year -8.33% - -2.44%

Software Engineering
Job Vacancy Trend in the North of England

Historical trend showing the proportion of permanent IT job postings citing Software Engineering relative to all permanent IT jobs advertised in the North of England.
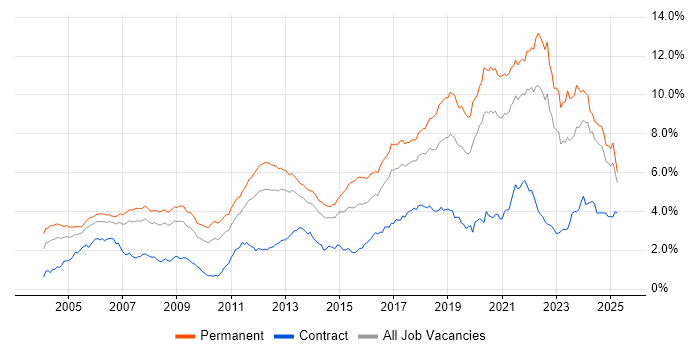
Software Engineering job vacancy trend in the North of England

Software Engineering
Salary Trend in the North of England

Salary distribution trend for jobs in the North of England citing Software Engineering.

Salary distribution trend for jobs in the North of England citing Software Engineering

Software Engineering
Salary Histogram in the North of England

Salary distribution for jobs citing Software Engineering in the North of England over the 6 months to 27 November 2025.

Salary histogram for Software Engineering in the North of England

Software Engineering
Job Locations in the North of England

The table below looks at the demand and provides a guide to the median salaries quoted in IT jobs citing Software Engineering within the North of England region over the 6 months to 27 November 2025. The 'Rank Change' column provides an indication of the change in demand within each location based on the same 6 month period last year.

Location Rank Change
on Same Period
Last Year
Matching
Permanent
IT Job Ads
Median Salary
Past 6 Months
Median Salary
% Change
on Same Period
Last Year
Live
Jobs
North West -29 229 £70,000 +21.74% 112
Yorkshire -14 219 £60,000 +9.09% 62
North East -16 50 £56,500 -2.59% 17
Software Engineering
England

Software Engineering
Co-Occurring Skills & Capabilities in the North of England by Category

The following tables expand on the one above by listing co-occurrences grouped by category. They cover the same employment type, locality and period, with up to 20 co-occurrences shown in each category:

Application Platforms
1 5 (1.00%) Apache Spark
2 4 (0.80%) Apache Airflow
2 4 (0.80%) Apache Solr
2 4 (0.80%) CMS
3 3 (0.60%) Apache
3 3 (0.60%) Headless CMS
4 2 (0.40%) Confluence
4 2 (0.40%) SAS
5 1 (0.20%) IIS
5 1 (0.20%) Microsoft Exchange
5 1 (0.20%) nginx
5 1 (0.20%) OpenStack
5 1 (0.20%) SharePoint
Applications
1 7 (1.41%) Microsoft Office
2 4 (0.80%) Autodesk Inventor
2 4 (0.80%) Chatbot
2 4 (0.80%) SOLIDWORKS
3 3 (0.60%) Microsoft Excel
4 2 (0.40%) Adobe XD
4 2 (0.40%) Sketch
5 1 (0.20%) Microsoft PowerPoint
5 1 (0.20%) Microsoft Project
5 1 (0.20%) MS Visio
Business Applications
1 4 (0.80%) Sage 200
2 2 (0.40%) Dynamics CRM
Cloud Services
1 147 (29.52%) AWS
2 119 (23.90%) Azure
3 61 (12.25%) SaaS
4 23 (4.62%) Serverless
5 21 (4.22%) GCP
6 20 (4.02%) GitHub
7 19 (3.82%) Azure DevOps
8 16 (3.21%) AWS Lambda
9 15 (3.01%) Amazon S3
10 14 (2.81%) Power Platform
11 10 (2.01%) Amazon EKS
11 10 (2.01%) IaaS
11 10 (2.01%) PaaS
12 7 (1.41%) Amazon ECS
12 7 (1.41%) AWS CloudFormation
12 7 (1.41%) Microsoft 365
13 5 (1.00%) Figma
13 5 (1.00%) GitHub Actions
14 4 (0.80%) Azure AKS
14 4 (0.80%) Power Automate
Communications & Networking
1 4 (0.80%) AMQP
2 2 (0.40%) HTTP
2 2 (0.40%) Internet
2 2 (0.40%) PuTTY
3 1 (0.20%) Ethernet
3 1 (0.20%) Modbus
3 1 (0.20%) MQTT
3 1 (0.20%) Profibus
3 1 (0.20%) TCP/IP
Database & Business Intelligence
1 27 (5.42%) NoSQL
2 22 (4.42%) SQL Server
3 20 (4.02%) PostgreSQL
4 16 (3.21%) DynamoDB
5 15 (3.01%) MongoDB
5 15 (3.01%) MySQL
6 13 (2.61%) Relational Database
7 8 (1.61%) Power BI
8 7 (1.41%) Data Warehouse
9 6 (1.20%) Big Data
9 6 (1.20%) Neo4j
10 5 (1.00%) Elasticsearch
11 4 (0.80%) Amazon RDS
11 4 (0.80%) Azure SQL Data Warehouse
11 4 (0.80%) Hadoop
11 4 (0.80%) Spark SQL
12 3 (0.60%) BigQuery
13 2 (0.40%) Amazon Redshift
13 2 (0.40%) Impala
13 2 (0.40%) Qlik Sense
Development Applications
1 22 (4.42%) Git
2 12 (2.41%) Visual Studio
3 10 (2.01%) Cypress.io
4 9 (1.81%) JIRA
5 8 (1.61%) GitLab
5 8 (1.61%) Jenkins
6 3 (0.60%) Selenium
7 2 (0.40%) CircleCI
7 2 (0.40%) webpack
8 1 (0.20%) Artifactory
8 1 (0.20%) Cucumber
8 1 (0.20%) Gatling
8 1 (0.20%) Jasmine
8 1 (0.20%) JUnit
8 1 (0.20%) Karma Test Runner
8 1 (0.20%) Maven
8 1 (0.20%) NUnit
8 1 (0.20%) Protractor
8 1 (0.20%) SonarQube
8 1 (0.20%) Sonatype Nexus
General
1 116 (23.29%) Social Skills
2 67 (13.45%) Finance
3 27 (5.42%) Analytical Skills
4 22 (4.42%) Retail
5 21 (4.22%) Manufacturing
6 20 (4.02%) Inclusion and Diversity
6 20 (4.02%) Public Sector
7 15 (3.01%) Marketing
8 14 (2.81%) Financial Institution
9 12 (2.41%) Electronics
9 12 (2.41%) Law
10 10 (2.01%) Games
11 9 (1.81%) Legal
12 7 (1.41%) Banking
12 7 (1.41%) Pharmaceutical
13 6 (1.20%) Influencing Skills
13 6 (1.20%) Organisational Skills
14 5 (1.00%) Billing
15 4 (0.80%) Telecoms
16 3 (0.60%) Aerospace
Job Titles
1 226 (45.38%) Software Engineer
2 119 (23.90%) Senior
3 73 (14.66%) Developer
4 66 (13.25%) Senior Software Engineer
5 58 (11.65%) Lead
6 26 (5.22%) Lead Software Engineer
7 20 (4.02%) .NET Software Engineer
8 18 (3.61%) C# Software Engineer
8 18 (3.61%) PLC Engineer
9 17 (3.41%) Architect
9 17 (3.41%) Graduate
9 17 (3.41%) Senior Developer
10 16 (3.21%) C# Developer
10 16 (3.21%) Embedded Engineer
10 16 (3.21%) Software Manager
11 15 (3.01%) Embedded Software Engineer
11 15 (3.01%) Java Engineer
12 14 (2.81%) Data Engineer
13 13 (2.61%) Head of Engineering
13 13 (2.61%) Software Developer
Libraries, Frameworks & Software Standards
1 113 (22.69%) .NET
2 95 (19.08%) React
3 49 (9.84%) Node.js
4 36 (7.23%) AngularJS
5 29 (5.82%) RESTful
6 28 (5.62%) CSS
7 27 (5.42%) .NET Core
7 27 (5.42%) HTML
7 27 (5.42%) Spring
8 24 (4.82%) REST
8 24 (4.82%) Spring Boot
9 18 (3.61%) .NET Framework
10 15 (3.01%) Vue
11 14 (2.81%) ASP.NET
12 13 (2.61%) Kafka
12 13 (2.61%) Next.js
13 10 (2.01%) CSS3
13 10 (2.01%) Entity Framework
13 10 (2.01%) FastAPI
13 10 (2.01%) HTML5
Miscellaneous
1 46 (9.24%) Cloud Native
2 33 (6.63%) Distributed Systems
3 31 (6.22%) Product Ownership
4 20 (4.02%) Renewable Energy
5 19 (3.82%) Greenfield Project
6 18 (3.61%) Cyberattack
7 12 (2.41%) SCADA
8 10 (2.01%) Embedded Systems
9 8 (1.61%) Enterprise Software
10 7 (1.41%) Driving Licence
10 7 (1.41%) Hedge funds
11 6 (1.20%) AI Agents
11 6 (1.20%) Legacy Systems
12 5 (1.00%) Distributed Computing
12 5 (1.00%) Foreign Exchange (FX)
13 4 (0.80%) Data Structures
13 4 (0.80%) Robotics
13 4 (0.80%) Self-Motivation
14 3 (0.60%) Mobile App
14 3 (0.60%) Public Cloud
Operating Systems
1 19 (3.82%) Linux
2 17 (3.41%) Windows
3 4 (0.80%) Unix
3 4 (0.80%) Windows Server
4 2 (0.40%) Android
4 2 (0.40%) Apple iOS
4 2 (0.40%) CentOS
4 2 (0.40%) Debian
4 2 (0.40%) Red Hat Enterprise Linux
4 2 (0.40%) Ubuntu
5 1 (0.20%) Fedora
Processes & Methodologies
1 156 (31.33%) Agile
2 129 (25.90%) CI/CD
3 114 (22.89%) Mentoring
4 100 (20.08%) DevOps
5 79 (15.86%) Problem-Solving
6 77 (15.46%) Microservices
7 74 (14.86%) Continuous Improvement
8 58 (11.65%) Coaching
9 55 (11.04%) Full-Stack Development
10 44 (8.84%) Containerisation
11 42 (8.43%) TDD
12 38 (7.63%) AI
13 37 (7.43%) Fintech
14 35 (7.03%) Computer Science
15 34 (6.83%) Infrastructure as Code
16 33 (6.63%) Technical Leadership
17 32 (6.43%) Project Delivery
18 31 (6.22%) Clean Code
18 31 (6.22%) SDLC
19 30 (6.02%) Roadmaps
Programming Languages
1 125 (25.10%) C#
2 86 (17.27%) Java
3 80 (16.06%) SQL
4 76 (15.26%) TypeScript
5 74 (14.86%) JavaScript
6 59 (11.85%) Python
7 37 (7.43%) C++
8 25 (5.02%) C
9 9 (1.81%) PHP
10 7 (1.41%) PL/SQL
10 7 (1.41%) Ruby
11 6 (1.20%) Delphi
11 6 (1.20%) Kotlin
12 5 (1.00%) Bash
12 5 (1.00%) Go
13 4 (0.80%) Scala
14 3 (0.60%) R
14 3 (0.60%) Rust
15 2 (0.40%) PROC SQL
15 2 (0.40%) Swift
Qualifications
1 37 (7.43%) Security Cleared
2 36 (7.23%) Degree
3 24 (4.82%) Computer Science Degree
4 18 (3.61%) DV Cleared
4 18 (3.61%) HND
4 18 (3.61%) SC Cleared
5 4 (0.80%) AWS Certification
6 3 (0.60%) DBS Check
6 3 (0.60%) Postgraduate
7 2 (0.40%) Azure Certification
7 2 (0.40%) BPSS Clearance
8 1 (0.20%) ITIL Foundation Certificate
8 1 (0.20%) Master's Degree
Quality Assurance & Compliance
1 24 (4.82%) QA
2 5 (1.00%) Accessibility
3 4 (0.80%) Data Quality
3 4 (0.80%) ISO 9001
4 3 (0.60%) GDPR
4 3 (0.60%) ISO 20022
4 3 (0.60%) SEPA
4 3 (0.60%) TARGET2
5 2 (0.40%) PCI DSS
6 1 (0.20%) Actionable Recommendations
6 1 (0.20%) IEC 61508
6 1 (0.20%) MISRA
6 1 (0.20%) MISRA C
System Software
1 61 (12.25%) Docker
2 19 (3.82%) Firmware
3 17 (3.41%) Embedded Firmware
4 2 (0.40%) Active Directory
4 2 (0.40%) Apache Flume
4 2 (0.40%) HDFS
5 1 (0.20%) KVM
5 1 (0.20%) QEMU
5 1 (0.20%) Virtual Machines
5 1 (0.20%) VMware Infrastructure
Systems Management
1 48 (9.64%) Kubernetes
2 39 (7.83%) Terraform
3 8 (1.61%) Grafana
4 7 (1.41%) Ansible
5 3 (0.60%) Prometheus
5 3 (0.60%) Puppet
6 2 (0.40%) Kibana
6 2 (0.40%) logstash
6 2 (0.40%) Oozie
6 2 (0.40%) Progress Chef
7 1 (0.20%) Oracle Enterprise Manager
Vendors
1 49 (9.84%) Microsoft
2 16 (3.21%) Cisco
2 16 (3.21%) Salesforce
3 7 (1.41%) BiZZdesign
3 7 (1.41%) Databricks
4 6 (1.20%) Google
4 6 (1.20%) Sage
5 5 (1.00%) SAP
6 4 (0.80%) Autodesk
6 4 (0.80%) Oracle
7 3 (0.60%) HubSpot
7 3 (0.60%) Red Hat
7 3 (0.60%) SaltStack
8 2 (0.40%) Concur
8 2 (0.40%) Informatica
8 2 (0.40%) MicroStrategy
9 1 (0.20%) Adobe
9 1 (0.20%) Avaya
9 1 (0.20%) Dynatrace
9 1 (0.20%) OpenAI