TCP/IP Jobs in the North of England

Transmission Control Protocol/Internet Protocol (TCP/IP)
England > North of England

The table below provides summary statistics for permanent job vacancies advertised in the North of England requiring TCP/IP skills. It includes a benchmarking guide to the annual salaries offered in vacancies that cited TCP/IP over the 6 months leading up to 26 July 2024, comparing them to the same period in the previous two years.

6 months to
26 Jul 2024
Same period 2023 Same period 2022
Rank 196 199 219
Rank change year-on-year +3 +20 -44
Permanent jobs citing TCP/IP 184 201 291
As % of all permanent jobs advertised in the North of England 1.13% 1.55% 1.52%
As % of the Communications & Networking category 10.33% 8.19% 11.34%
Number of salaries quoted 134 152 251
10th Percentile £25,150 £27,000 £23,375
25th Percentile £29,250 £35,000 £26,250
Median annual salary (50th Percentile) £37,750 £46,250 £40,000
Median % change year-on-year -18.38% +15.63% -11.11%
75th Percentile £48,750 £58,000 £50,000
90th Percentile £53,750 £65,313 £58,750
England median annual salary £42,500 £45,000 £44,438
% change year-on-year -5.56% +1.27% -9.31%

All Communications and Computer Networking Skills
North of England

TCP/IP falls under the Communications and Computer Networking category. For comparison with the information above, the following table provides summary statistics for all permanent job vacancies requiring communications or computer networking skills in the North of England.

Permanent vacancies with a requirement for communications or computer networking skills 1,781 2,453 2,566
As % of all permanent jobs advertised in the North of England 10.93% 18.90% 13.39%
Number of salaries quoted 1,262 1,110 1,843
10th Percentile £26,250 £27,750 £26,250
25th Percentile £31,250 £35,000 £34,000
Median annual salary (50th Percentile) £45,000 £47,000 £47,500
Median % change year-on-year -4.26% -1.05% +5.56%
75th Percentile £61,000 £62,833 £60,000
90th Percentile £70,000 £77,500 £73,675
England median annual salary £48,500 £50,985 £52,500
% change year-on-year -4.87% -2.89% +5.00%

TCP/IP
Job Vacancy Trend in the North of England

Job postings citing TCP/IP as a proportion of all IT jobs advertised in the North of England.
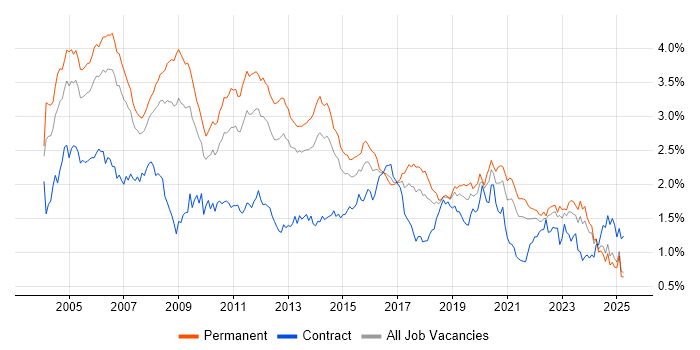
Job vacancy trend for TCP/IP in the North of England

TCP/IP
Salary Trend in the North of England

3-month moving average salary quoted in jobs citing TCP/IP in the North of England.

Salary trend for TCP/IP in the North of England

TCP/IP
Salary Histogram in the North of England

Salary distribution for jobs citing TCP/IP in the North of England over the 6 months to 26 July 2024.

Salary histogram for TCP/IP in the North of England

TCP/IP
Job Locations in the North of England

The table below looks at the demand and provides a guide to the median salaries quoted in IT jobs citing TCP/IP within the North of England region over the 6 months to 26 July 2024. The 'Rank Change' column provides an indication of the change in demand within each location based on the same 6 month period last year.

Location Rank Change
on Same Period
Last Year
Matching
Permanent
IT Job Ads
Median Salary
Past 6 Months
Median Salary
% Change
on Same Period
Last Year
Live
Jobs
North West +6 95 £40,000 -14.89% 25
Yorkshire +40 85 £37,000 -17.78% 18
North East -19 4 £30,750 -10.22% 7
TCP/IP
England

TCP/IP
Co-occurring Skills and Capabilities in the North of England by Category

The follow tables expand on the table above by listing co-occurrences grouped by category. The same employment type, locality and period is covered with up to 20 co-occurrences shown in each of the following categories:

Application Platforms
1 23 (12.50%) Microsoft Exchange
2 12 (6.52%) WebLogic
3 8 (4.35%) SharePoint
4 7 (3.80%) Apache
4 7 (3.80%) IIS
5 3 (1.63%) WebSphere
5 3 (1.63%) WebSphere Application Server
6 1 (0.54%) OpenStack
6 1 (0.54%) SharePoint Server
Applications
1 38 (20.65%) Microsoft Office
2 3 (1.63%) Microsoft Excel
3 2 (1.09%) Microsoft PowerPoint
Business Applications
1 12 (6.52%) Sparx Enterprise Architect
2 1 (0.54%) Epicor Tropos
Cloud Services
1 65 (35.33%) Azure
2 49 (26.63%) Microsoft 365
3 21 (11.41%) AWS
4 15 (8.15%) Entra ID
5 12 (6.52%) Amazon EKS
5 12 (6.52%) Amazon SQS
6 8 (4.35%) IaaS
6 8 (4.35%) PaaS
7 5 (2.72%) Cloud Computing
7 5 (2.72%) Snowflake
8 4 (2.17%) Azure Sentinel
8 4 (2.17%) Azure Stack
8 4 (2.17%) Nutanix
9 2 (1.09%) Azure AKS
9 2 (1.09%) Azure DevOps
9 2 (1.09%) Azure ExpressRoute
9 2 (1.09%) Azure Logic Apps
9 2 (1.09%) Dynamics 365
10 1 (0.54%) Power Platform
10 1 (0.54%) SaaS
Communications & Networking
1 92 (50.00%) DNS
2 78 (42.39%) DHCP
3 69 (37.50%) Firewall
4 60 (32.61%) LAN
5 59 (32.07%) WAN
6 45 (24.46%) VPN
7 40 (21.74%) BGP
8 31 (16.85%) Internet
9 28 (15.22%) OSPF
9 28 (15.22%) Wireless
10 26 (14.13%) MPLS
11 22 (11.96%) SSL
12 17 (9.24%) Ethernet
13 16 (8.70%) Wi-Fi
13 16 (8.70%) WLAN
14 12 (6.52%) Network Security
15 11 (5.98%) DSL
16 10 (5.43%) VLAN
17 9 (4.89%) VoIP
18 8 (4.35%) SSH
Database & Business Intelligence
1 12 (6.52%) Amazon RDS
1 12 (6.52%) Oracle Database
1 12 (6.52%) RDBMS
1 12 (6.52%) Relational Database
2 9 (4.89%) SQL Server
3 5 (2.72%) Elasticsearch
3 5 (2.72%) NoSQL
3 5 (2.72%) Redis
4 1 (0.54%) Crystal Reports
4 1 (0.54%) Power BI
4 1 (0.54%) SQL Server Reporting Services
Development Applications
1 4 (2.17%) Git
1 4 (2.17%) Subversion
2 3 (1.63%) Fiddler
3 1 (0.54%) Burp Suite
3 1 (0.54%) Metasploit
General
1 72 (39.13%) Social Skills
2 20 (10.87%) Analytical Skills
3 15 (8.15%) Finance
4 9 (4.89%) Military
5 6 (3.26%) Retail
6 5 (2.72%) Organisational Skills
7 4 (2.17%) Agriculture
7 4 (2.17%) Electronics
8 3 (1.63%) Marketing
9 2 (1.09%) Law
9 2 (1.09%) Legal
10 1 (0.54%) Inclusion and Diversity
10 1 (0.54%) Manufacturing
10 1 (0.54%) Police
10 1 (0.54%) Presentation Skills
10 1 (0.54%) Telecoms
Job Titles
1 40 (21.74%) Analyst
2 29 (15.76%) Network Engineer
3 25 (13.59%) Senior
4 24 (13.04%) Lead
5 20 (10.87%) Architect
5 20 (10.87%) IT Support
6 18 (9.78%) Support Engineer
7 17 (9.24%) 2nd Line Support
8 15 (8.15%) Support Analyst
9 13 (7.07%) IT Analyst
10 12 (6.52%) IT Support Analyst
10 12 (6.52%) Lead Architect
10 12 (6.52%) Lead Solutions Architect
10 12 (6.52%) Solutions Architect
11 10 (5.43%) 2nd Line Engineer
11 10 (5.43%) Service Analyst
11 10 (5.43%) Software Engineer
12 9 (4.89%) 2nd Line Support Analyst
12 9 (4.89%) IT Technician
12 9 (4.89%) Service Desk Analyst
Libraries, Frameworks & Software Standards
1 12 (6.52%) RabbitMQ
1 12 (6.52%) Spring Boot
2 9 (4.89%) .NET
3 5 (2.72%) CSS
3 5 (2.72%) HTML
3 5 (2.72%) Middleware
4 4 (2.17%) AngularJS
4 4 (2.17%) ASP.NET
4 4 (2.17%) ASP.NET MVC
4 4 (2.17%) ASP.NET Web API
4 4 (2.17%) jQuery
4 4 (2.17%) React
4 4 (2.17%) REST
4 4 (2.17%) Tailwind CSS
4 4 (2.17%) Twitter Bootstrap
4 4 (2.17%) Vue
4 4 (2.17%) WCF
4 4 (2.17%) Web Services
4 4 (2.17%) WinForms
4 4 (2.17%) WPF
Miscellaneous
1 23 (12.50%) Public Cloud
2 14 (7.61%) Management Information System
3 12 (6.52%) Enterprise Software
4 11 (5.98%) Self-Motivation
5 10 (5.43%) Cyberattack
6 9 (4.89%) Data Centre
7 7 (3.80%) Distributed Computing
8 6 (3.26%) Clustering
8 6 (3.26%) Driving Licence
8 6 (3.26%) Private Cloud
9 4 (2.17%) Replication
10 3 (1.63%) Embedded Systems
11 2 (1.09%) Client/Server
11 2 (1.09%) Cyber Threat
11 2 (1.09%) Security Posture
12 1 (0.54%) Cyber Security Posture
12 1 (0.54%) Data Protection Act
12 1 (0.54%) NHS
12 1 (0.54%) Onboarding
12 1 (0.54%) Video Conferencing
Operating Systems
1 103 (55.98%) Windows
2 52 (28.26%) Linux
3 49 (26.63%) Windows Server
4 43 (23.37%) Windows 10
5 18 (9.78%) Android
6 13 (7.07%) Apple iOS
6 13 (7.07%) Red Hat Enterprise Linux
7 7 (3.80%) Windows 7
8 6 (3.26%) VMS
8 6 (3.26%) VyOS
8 6 (3.26%) Windows Server 2012
9 4 (2.17%) Mac OS X
10 3 (1.63%) Unix
10 3 (1.63%) Windows Server 2016
11 2 (1.09%) Mac OS
11 2 (1.09%) Windows Server 2003
11 2 (1.09%) Windows Server 2019
12 1 (0.54%) Embedded Linux
12 1 (0.54%) Kali Linux
12 1 (0.54%) SUSE
Processes & Methodologies
1 57 (30.98%) Customer Service
2 52 (28.26%) Problem-Solving
3 32 (17.39%) Computer Science
4 28 (15.22%) Cybersecurity
5 26 (14.13%) Collaborative Working
6 25 (13.59%) ITIL
7 22 (11.96%) Project Management
8 19 (10.33%) Agile
9 17 (9.24%) Load Balancing
9 17 (9.24%) Scrum
9 17 (9.24%) TOGAF
10 15 (8.15%) Software Engineering
11 13 (7.07%) Migration
12 12 (6.52%) ArchiMate
12 12 (6.52%) Data Migration
12 12 (6.52%) Kanban
12 12 (6.52%) Open Source
12 12 (6.52%) Service Management
12 12 (6.52%) Time Management
12 12 (6.52%) Vulnerability Management
Programming Languages
1 20 (10.87%) Python
2 18 (9.78%) PowerShell
3 17 (9.24%) SQL
4 10 (5.43%) C#
5 4 (2.17%) C++
5 4 (2.17%) XAML
6 3 (1.63%) Bash
6 3 (1.63%) JavaScript
7 2 (1.09%) Java
8 1 (0.54%) C
8 1 (0.54%) Embedded C
8 1 (0.54%) Go
8 1 (0.54%) Ruby
8 1 (0.54%) VBScript
Qualifications
1 45 (24.46%) Degree
2 39 (21.20%) Cisco Certification
3 35 (19.02%) CCNA
4 26 (14.13%) Computer Science Degree
5 24 (13.04%) Microsoft Certification
6 20 (10.87%) Security Cleared
7 18 (9.78%) Azure Certification
8 17 (9.24%) SC Cleared
9 15 (8.15%) CCNP
10 12 (6.52%) AWS Certification
10 12 (6.52%) AWS Certified Solutions Architect
10 12 (6.52%) JNCIA
11 9 (4.89%) CISSP
12 8 (4.35%) MCSA
13 6 (3.26%) ITIL Foundation Certificate
14 5 (2.72%) MCP
14 5 (2.72%) MCSE
14 5 (2.72%) TOGAF Certification
14 5 (2.72%) VMware Certified Professional (VCP)
15 4 (2.17%) CCIE
Quality Assurance & Compliance
1 27 (14.67%) SLA
2 4 (2.17%) ISO/IEC 27001
2 4 (2.17%) PMO
3 1 (0.54%) GDPR
3 1 (0.54%) HIPAA
3 1 (0.54%) ISO 22301
3 1 (0.54%) NIST
3 1 (0.54%) Sarbanes-Oxley
System Software
1 73 (39.67%) Active Directory
2 31 (16.85%) VMware Infrastructure
3 27 (14.67%) Hyper-V
4 5 (2.72%) Virtual Machines
4 5 (2.72%) vSphere
5 4 (2.17%) Firmware
5 4 (2.17%) vCloud
6 2 (1.09%) VMware NSX
7 1 (0.54%) Docker
7 1 (0.54%) Embedded Firmware
7 1 (0.54%) Lustre
7 1 (0.54%) Slurm Workload Manager
7 1 (0.54%) Terminal Server
7 1 (0.54%) VMware ESXi
Systems Management
1 20 (10.87%) SCCM
2 16 (8.70%) Microsoft Intune
3 11 (5.98%) WSUS
4 10 (5.43%) Kubernetes
5 7 (3.80%) Grafana
6 6 (3.26%) SCOM
7 5 (2.72%) Prometheus
8 4 (2.17%) Ansible
8 4 (2.17%) IBM BigFix
9 3 (1.63%) CA Single Sign-On
10 2 (1.09%) Failover Clustering
10 2 (1.09%) Terraform
11 1 (0.54%) FortiGate
11 1 (0.54%) Icinga
11 1 (0.54%) Nmap
11 1 (0.54%) Proxmox
11 1 (0.54%) vCenter Server
Vendors
1 81 (44.02%) Microsoft
2 47 (25.54%) VMware
3 33 (17.93%) Cisco
4 18 (9.78%) Juniper
5 17 (9.24%) Fortinet
5 17 (9.24%) Oracle
6 16 (8.70%) SolarWinds
7 12 (6.52%) Sparx
8 11 (5.98%) Nokia
8 11 (5.98%) Ruckus Wireless
8 11 (5.98%) ServiceNow
9 9 (4.89%) Veeam
10 7 (3.80%) Citrix
11 6 (3.26%) Vyatta
12 5 (2.72%) LogicMonitor
12 5 (2.72%) SAP
12 5 (2.72%) Splunk
13 4 (2.17%) Remedy
14 3 (1.63%) Dynatrace
14 3 (1.63%) Palo Alto