Inclusion and Diversity Jobs in the North of England

Inclusion and Diversity
England > North of England

The table below looks at the prevalence of the term Inclusion and Diversity in permanent job vacancies advertised in the North of England. Included is a benchmarking guide to the salaries offered in vacancies that have cited Inclusion and Diversity over the 6 months to 30 November 2023 with a comparison to the same period over the previous 2 years.

6 months to
30 Nov 2023
Same period 2022 Same period 2021
Rank 63 53 172
Rank change year-on-year -10 +119 +118
Permanent jobs citing Inclusion and Diversity 348 919 323
As % of all permanent jobs advertised in the North of England 4.42% 5.40% 1.93%
As % of the General category 6.69% 8.22% 3.61%
Number of salaries quoted 119 255 158
10th Percentile £32,092 £30,000 £32,500
25th Percentile £41,137 £37,734 £35,313
Median annual salary (50th Percentile) £60,000 £54,882 £53,071
Median % change year-on-year +9.33% +3.41% +9.42%
75th Percentile £75,625 £66,250 £65,225
90th Percentile £84,056 £84,600 £76,814
England median annual salary £70,000 £62,500 £55,000
% change year-on-year +12.00% +13.64% -

All General Skills
North of England

Inclusion and Diversity is in the General Skills category. The following table is for comparison with the above and provides summary statistics for all permanent job vacancies advertised in the North of England with a requirement for common skills.

Permanent vacancies with a requirement for common skills 5,202 11,175 8,940
As % of all permanent jobs advertised in the North of England 66.02% 65.72% 53.32%
Number of salaries quoted 3,578 6,042 5,953
10th Percentile £27,750 £28,500 £27,500
25th Percentile £37,900 £38,500 £35,000
Median annual salary (50th Percentile) £52,500 £52,500 £47,500
Median % change year-on-year - +10.53% +4.31%
75th Percentile £69,800 £67,500 £62,500
90th Percentile £84,056 £84,056 £77,500
England median annual salary £60,000 £60,000 £60,000
% change year-on-year - - +4.35%

Inclusion and Diversity
Job Vacancy Trend in the North of England

Job postings citing Inclusion and Diversity as a proportion of all IT jobs advertised in the North of England.
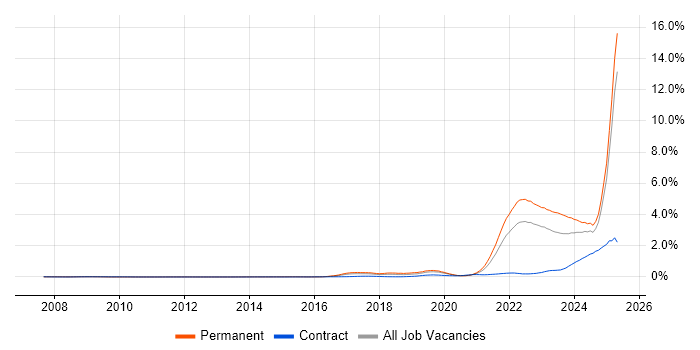
Job vacancy trend for Inclusion and Diversity in the North of England

Inclusion and Diversity
Salary Trend in the North of England

3-month moving average salary quoted in jobs citing Inclusion and Diversity in the North of England.

Salary trend for Inclusion and Diversity in the North of England

Inclusion and Diversity
Salary Histogram in the North of England

Salary distribution for jobs citing Inclusion and Diversity in the North of England over the 6 months to 30 November 2023.

Salary histogram for Inclusion and Diversity in the North of England

Inclusion and Diversity
Job Locations in the North of England

The table below looks at the demand and provides a guide to the median salaries quoted in IT jobs citing Inclusion and Diversity within the North of England region over the 6 months to 30 November 2023. The 'Rank Change' column provides an indication of the change in demand within each location based on the same 6 month period last year.

Location Rank Change
on Same Period
Last Year
Matching
Permanent
IT Job Ads
Median Salary
Past 6 Months
Median Salary
% Change
on Same Period
Last Year
Live
Jobs
North West -13 207 £51,380 +0.82% 129
Yorkshire -7 109 £75,000 +36.36% 42
North East +51 32 £62,500 -3.85% 37
Inclusion and Diversity
England

Inclusion and Diversity
Co-occurring Skills and Capabilities in the North of England by Category

The follow tables expand on the table above by listing co-occurrences grouped by category. The same employment type, locality and period is covered with up to 20 co-occurrences shown in each of the following categories:

Application Platforms
1 14 (4.02%) SAS
2 2 (0.57%) SharePoint
3 1 (0.29%) Apache Pulsar
3 1 (0.29%) IIS
Applications
1 31 (8.91%) Microsoft Excel
2 12 (3.45%) Microsoft Office
3 4 (1.15%) AutoCAD
3 4 (1.15%) Windchill
4 1 (0.29%) Microsoft PowerPoint
Business Applications
1 30 (8.62%) Oracle Payables
2 26 (7.47%) Oracle Receivables
3 13 (3.74%) NetSuite
4 5 (1.44%) Oracle Procure-to-Pay
5 2 (0.57%) Dynamics NAV
6 1 (0.29%) SAP MDG
6 1 (0.29%) SAP Retail
6 1 (0.29%) SAP S/4HANA
6 1 (0.29%) SAP SD
Cloud Services
1 100 (28.74%) Azure
2 77 (22.13%) AWS
3 61 (17.53%) GCP
4 30 (8.62%) PaaS
5 29 (8.33%) IaaS
5 29 (8.33%) SaaS
6 16 (4.60%) Azure DevOps
6 16 (4.60%) OpenShift
7 14 (4.02%) dbt
8 12 (3.45%) Serverless
9 7 (2.01%) Amazon ECS
9 7 (2.01%) AWS CloudFormation
9 7 (2.01%) Cloud Computing
9 7 (2.01%) Power Platform
10 4 (1.15%) AWS Lambda
10 4 (1.15%) Pulumi
11 3 (0.86%) Azure Sentinel
11 3 (0.86%) Microsoft 365
12 2 (0.57%) Azure Synapse Analytics
12 2 (0.57%) Microsoft Purview
Communications & Networking
1 30 (8.62%) 5G
1 30 (8.62%) Broadband
2 6 (1.72%) TCP/IP
3 5 (1.44%) Skype
4 4 (1.15%) Wireshark
5 3 (0.86%) DNS
5 3 (0.86%) Firewall
5 3 (0.86%) SAN
6 2 (0.57%) Wi-Fi
7 1 (0.29%) Cisco ASA
7 1 (0.29%) DHCP
7 1 (0.29%) FTP
7 1 (0.29%) LAN
7 1 (0.29%) Network Security
7 1 (0.29%) VLAN
7 1 (0.29%) VoIP
7 1 (0.29%) WAN
7 1 (0.29%) Wireless
Database & Business Intelligence
1 26 (7.47%) Elasticsearch
2 23 (6.61%) MongoDB
2 23 (6.61%) NoSQL
3 22 (6.32%) Data Lake
4 20 (5.75%) Data Warehouse
5 15 (4.31%) Metadata
6 13 (3.74%) Base SAS
7 12 (3.45%) PostgreSQL
8 7 (2.01%) Power BI
9 6 (1.72%) SQL Server
10 5 (1.44%) Redis
11 4 (1.15%) MySQL
12 3 (0.86%) Hadoop
13 2 (0.57%) Azure SQL Data Warehouse
13 2 (0.57%) Azure SQL Database
13 2 (0.57%) QlikView
13 2 (0.57%) Sisense
13 2 (0.57%) SQL Server Integration Services
13 2 (0.57%) Tableau
14 1 (0.29%) BusinessObjects Business Intelligence
Development Applications
1 23 (6.61%) Jenkins
2 16 (4.60%) Cucumber
2 16 (4.60%) Cypress.io
2 16 (4.60%) Selenium
3 15 (4.31%) Git
4 6 (1.72%) GitLab
5 4 (1.15%) AutoIt
5 4 (1.15%) eggPlant
5 4 (1.15%) Maven
5 4 (1.15%) Mocha
6 1 (0.29%) JIRA
6 1 (0.29%) TestCafe
General
1 133 (38.22%) Finance
2 112 (32.18%) Social Skills
3 43 (12.36%) Retail
4 36 (10.34%) Law
4 36 (10.34%) Legal
5 26 (7.47%) Aerospace
6 20 (5.75%) Analytical Skills
7 18 (5.17%) Banking
7 18 (5.17%) Public Sector
8 16 (4.60%) Pharmaceutical
9 14 (4.02%) Marketing
10 13 (3.74%) Presentation Skills
11 6 (1.72%) Local Government
11 6 (1.72%) Manufacturing
12 5 (1.44%) Billing
13 4 (1.15%) Automotive
13 4 (1.15%) Back Office
13 4 (1.15%) Digital Economy
13 4 (1.15%) Influencing Skills
14 1 (0.29%) Telecoms
Job Titles
1 80 (22.99%) Senior
2 53 (15.23%) Analyst
3 46 (13.22%) Software Engineer
4 41 (11.78%) Lead
5 30 (8.62%) Architect
6 26 (7.47%) Operations Analyst
7 25 (7.18%) Developer
8 20 (5.75%) Enterprise Architect
9 17 (4.89%) Commercial Architect
10 16 (4.60%) Business Manager
11 15 (4.31%) Project Manager
12 14 (4.02%) DevOps Engineer
12 14 (4.02%) Lead Software Engineer
13 13 (3.74%) Programmer
13 13 (3.74%) SAS Programmer
13 13 (3.74%) SAS Statistical Programmer
13 13 (3.74%) Statistical Programmer
14 12 (3.45%) Senior Software Engineer
14 12 (3.45%) Trainee
15 10 (2.87%) Designer
Libraries, Frameworks & Software Standards
1 44 (12.64%) Node.js
2 33 (9.48%) .NET
3 23 (6.61%) REST
4 19 (5.46%) Kafka
5 18 (5.17%) JWT
5 18 (5.17%) OpenID
5 18 (5.17%) Web Services
6 14 (4.02%) React
7 13 (3.74%) XML
8 12 (3.45%) Jest
9 8 (2.30%) Next.js
10 7 (2.01%) Django
11 5 (1.44%) Spring Boot
12 4 (1.15%) Chai
12 4 (1.15%) CSS
12 4 (1.15%) CSS3
12 4 (1.15%) HTML
12 4 (1.15%) HTML5
12 4 (1.15%) Oracle Fusion
12 4 (1.15%) Spring
Miscellaneous
1 63 (18.10%) Self-Motivation
2 43 (12.36%) Cyberattack
3 42 (12.07%) Driving Licence
4 29 (8.33%) Public Cloud
5 24 (6.90%) Linux Command Line
6 19 (5.46%) Onboarding
7 18 (5.17%) Blockchain
7 18 (5.17%) Mainframe
8 15 (4.31%) Life Science
9 14 (4.02%) Product Ownership
10 11 (3.16%) Management Information System
11 6 (1.72%) Blog
11 6 (1.72%) Cloud Native
12 5 (1.44%) Distributed Systems
13 4 (1.15%) e-Learning
13 4 (1.15%) Enterprise Software
14 3 (0.86%) Hackathon
14 3 (0.86%) Renewable Energy
15 2 (0.57%) Analytical Mindset
15 2 (0.57%) Reference Data
Operating Systems
1 31 (8.91%) Linux
2 24 (6.90%) Unix
3 3 (0.86%) Windows
3 3 (0.86%) Windows Server
4 1 (0.29%) VMS
Processes & Methodologies
1 141 (40.52%) Agile
2 72 (20.69%) Software Engineering
3 68 (19.54%) Problem-Solving
4 55 (15.80%) Project Delivery
5 54 (15.52%) Mentoring
5 54 (15.52%) Microservices
6 52 (14.94%) Scrum
7 43 (12.36%) DevOps
8 42 (12.07%) Machine Learning
8 42 (12.07%) User Experience
9 39 (11.21%) Project Management
10 38 (10.92%) Customer Service
11 34 (9.77%) Roadmaps
12 33 (9.48%) Coaching
12 33 (9.48%) Site Reliability Engineering
13 31 (8.91%) Line Management
14 30 (8.62%) Accounts Payable
14 30 (8.62%) Feasibility Study
14 30 (8.62%) Knowledge Transfer
15 28 (8.05%) Software Delivery
Programming Languages
1 71 (20.40%) Python
2 62 (17.82%) Java
3 53 (15.23%) JavaScript
4 31 (8.91%) SQL
5 29 (8.33%) Rust
6 25 (7.18%) C++
7 23 (6.61%) Go
8 13 (3.74%) SAS Macro
8 13 (3.74%) TypeScript
9 12 (3.45%) Bash
10 10 (2.87%) C#
11 3 (0.86%) C
11 3 (0.86%) T-SQL
12 2 (0.57%) PowerShell
13 1 (0.29%) R
Qualifications
1 92 (26.44%) Security Cleared
2 75 (21.55%) Degree
3 33 (9.48%) DV Cleared
3 33 (9.48%) Postgraduate
4 28 (8.05%) SC Cleared
5 26 (7.47%) AWS Certification
6 23 (6.61%) AWS Certified Cloud Practitioner
6 23 (6.61%) AWS Certified Developer
6 23 (6.61%) AWS Certified Solutions Architect
7 11 (3.16%) Master's Degree
8 8 (2.30%) BPSS Clearance
9 7 (2.01%) Numerate Degree
10 6 (1.72%) Chartered Engineer
11 5 (1.44%) PhD
12 3 (0.86%) ACCA
12 3 (0.86%) CEH
12 3 (0.86%) CISSP
13 2 (0.57%) CISM
13 2 (0.57%) GIAC
13 2 (0.57%) MBA
Quality Assurance & Compliance
1 44 (12.64%) QA
2 16 (4.60%) Accessibility
3 13 (3.74%) CDISC
4 6 (1.72%) GMP
5 5 (1.44%) WCAG
6 3 (0.86%) GAAP
6 3 (0.86%) IFRS
7 2 (0.57%) Data Quality
7 2 (0.57%) GDPR
7 2 (0.57%) ISO 9001
7 2 (0.57%) ISO/IEC 27001
7 2 (0.57%) NIST
7 2 (0.57%) NIST 800
7 2 (0.57%) PCI DSS
8 1 (0.29%) SLA
System Software
1 37 (10.63%) Docker
2 26 (7.47%) Virtual Machines
3 13 (3.74%) Active Directory
4 3 (0.86%) SRDF
5 2 (0.57%) VMware Infrastructure
6 1 (0.29%) Hyper-V
Systems Management
1 68 (19.54%) Kubernetes
2 25 (7.18%) Terraform
3 11 (3.16%) Ansible
4 4 (1.15%) Argo
5 3 (0.86%) Istio
6 2 (0.57%) Microsoft Intune
6 2 (0.57%) Puppet
7 1 (0.29%) Salt
Vendors
1 43 (12.36%) Oracle
2 30 (8.62%) Virgin Media
3 22 (6.32%) Microsoft
4 6 (1.72%) SAP
5 5 (1.44%) Google
6 3 (0.86%) ANSYS
6 3 (0.86%) Brocade
6 3 (0.86%) CA
6 3 (0.86%) EMC
6 3 (0.86%) New Relic
7 2 (0.57%) Databricks
7 2 (0.57%) ServiceNow
7 2 (0.57%) Veeam
7 2 (0.57%) VMware
8 1 (0.29%) Datto
8 1 (0.29%) HP
8 1 (0.29%) Splunk
8 1 (0.29%) Sun
8 1 (0.29%) Ubiquiti
8 1 (0.29%) WatchGuard