Time Management Jobs in the North West

Time Management
England > North West

The following table provides summary statistics for permanent job vacancies advertised in the North West with a requirement for Time Management skills. Included is a benchmarking guide to the salaries offered in vacancies that have cited Time Management over the 6 months to 19 April 2024 with a comparison to the same period in the previous 2 years.

6 months to
19 Apr 2024
Same period 2023 Same period 2022
Rank 100 157 156
Rank change year-on-year +57 -1 -37
Permanent jobs citing Time Management 230 158 193
As % of all permanent jobs advertised in the North West 2.40% 1.95% 2.04%
As % of the Processes & Methodologies category 2.88% 2.03% 2.14%
Number of salaries quoted 142 91 141
10th Percentile £22,750 £22,000 £23,000
25th Percentile £25,000 £29,250 £31,000
Median annual salary (50th Percentile) £32,500 £39,000 £42,500
Median % change year-on-year -16.67% -8.24% +13.33%
75th Percentile £49,500 £57,500 £57,250
90th Percentile £60,000 £67,500 £65,000
England median annual salary £40,000 £52,500 £47,500
% change year-on-year -23.81% +10.53% +5.56%

All Process and Methodology Skills
North West

Time Management is in the Processes and Methodologies category. The following table is for comparison with the above and provides summary statistics for all permanent job vacancies advertised in the North West with a requirement for process or methodology skills.

Permanent vacancies with a requirement for process or methodology skills 7,976 7,771 9,023
As % of all permanent jobs advertised in the North West 83.34% 95.80% 95.23%
Number of salaries quoted 6,093 3,995 5,418
10th Percentile £27,750 £30,500 £30,274
25th Percentile £37,500 £41,250 £39,000
Median annual salary (50th Percentile) £50,000 £55,000 £52,500
Median % change year-on-year -9.09% +4.76% +8.25%
75th Percentile £65,603 £70,000 £67,500
90th Percentile £80,000 £82,500 £82,500
England median annual salary £55,000 £62,500 £60,000
% change year-on-year -12.00% +4.17% +9.09%

Time Management
Job Vacancy Trend in the North West

Job postings citing Time Management as a proportion of all IT jobs advertised in the North West.
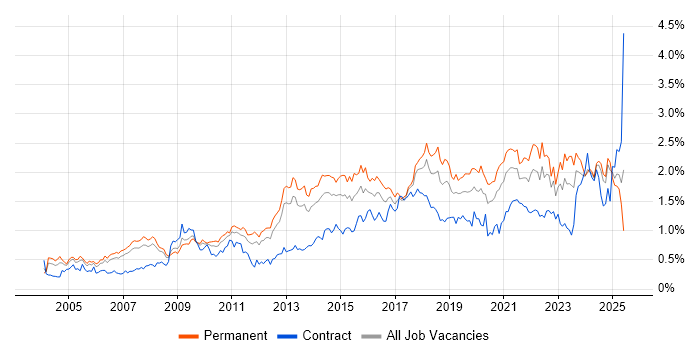
Job vacancy trend for Time Management in the North West

Time Management
Salary Trend in the North West

3-month moving average salary quoted in jobs citing Time Management in the North West.

Salary trend for Time Management in the North West

Time Management
Salary Histogram in the North West

Salary distribution for jobs citing Time Management in the North West over the 6 months to 19 April 2024.

Salary histogram for Time Management in the North West

Time Management
Job Locations in the North West

The table below looks at the demand and provides a guide to the median salaries quoted in IT jobs citing Time Management within the North West region over the 6 months to 19 April 2024. The 'Rank Change' column provides an indication of the change in demand within each location based on the same 6 month period last year.

Location Rank Change
on Same Period
Last Year
Matching
Permanent
IT Job Ads
Median Salary
Past 6 Months
Median Salary
% Change
on Same Period
Last Year
Live
Jobs
Manchester +72 117 £40,000 -11.11% 48
Cheshire +33 79 £24,750 +7.61% 19
Merseyside -24 16 £37,500 -5.06% 15
Lancashire 0 10 £31,250 -43.18% 10
Cumbria - 7 £25,000 - 3
Time Management
England

Time Management
Co-occurring Skills and Capabilities in the North West by Category

The follow tables expand on the table above by listing co-occurrences grouped by category. The same employment type, locality and period is covered with up to 20 co-occurrences shown in each of the following categories:

Application Platforms
1 10 (4.35%) SharePoint
2 5 (2.17%) CMS
2 5 (2.17%) Microsoft Exchange
3 4 (1.74%) Confluence
3 4 (1.74%) SAS
3 4 (1.74%) Skype for Business
4 2 (0.87%) WordPress
5 1 (0.43%) OpenStack
Applications
1 23 (10.00%) Microsoft Excel
2 18 (7.83%) Microsoft Office
3 10 (4.35%) Microsoft PowerPoint
4 5 (2.17%) AutoCAD
5 4 (1.74%) Microsoft Project
5 4 (1.74%) Spreadsheet
6 2 (0.87%) SPSS
6 2 (0.87%) Stata
7 1 (0.43%) Adobe Creative Suite
7 1 (0.43%) Adobe Illustrator
7 1 (0.43%) InDesign
7 1 (0.43%) Photoshop
Business Applications
1 7 (3.04%) NetSuite
2 5 (2.17%) Dynamics CRM
3 4 (1.74%) MIS ActiveH
3 4 (1.74%) Shopify
4 1 (0.43%) Oracle Procure-to-Pay
4 1 (0.43%) Sage X3
Cloud Services
1 48 (20.87%) Microsoft 365
2 30 (13.04%) Azure
3 11 (4.78%) Power Platform
4 10 (4.35%) AWS
5 7 (3.04%) Entra ID
6 6 (2.61%) SaaS
7 5 (2.17%) GCP
7 5 (2.17%) OneDrive
8 4 (1.74%) Amazon EC2
8 4 (1.74%) Amazon S3
8 4 (1.74%) Dynamics 365
9 3 (1.30%) Cloud Computing
9 3 (1.30%) Slack
10 2 (0.87%) Azure DevOps
10 2 (0.87%) GitHub
10 2 (0.87%) SuccessFactors
11 1 (0.43%) Amazon SQS
11 1 (0.43%) Firebase
11 1 (0.43%) MailChimp
11 1 (0.43%) OpenShift
Communications & Networking
1 14 (6.09%) WAN
2 11 (4.78%) Broadband
2 11 (4.78%) Internet
3 8 (3.48%) Firewall
3 8 (3.48%) SD-WAN
4 6 (2.61%) LAN
5 5 (2.17%) TCP/IP
6 4 (1.74%) Cisco Firepower
6 4 (1.74%) Skype
6 4 (1.74%) Unified Communications
7 3 (1.30%) DNS
7 3 (1.30%) VoIP
8 2 (0.87%) Wireless
9 1 (0.43%) Bluetooth
9 1 (0.43%) DHCP
9 1 (0.43%) InfiniBand
9 1 (0.43%) Intranet
9 1 (0.43%) SAN
9 1 (0.43%) VPN
Database & Business Intelligence
1 10 (4.35%) Power BI
2 8 (3.48%) SQL Server
3 2 (0.87%) Data Warehouse
3 2 (0.87%) Electronic Patient Records
4 1 (0.43%) NoSQL
4 1 (0.43%) Redis
Development Applications
1 9 (3.91%) JIRA
2 8 (3.48%) Git
3 6 (2.61%) Eclipse
4 5 (2.17%) NUnit
5 2 (0.87%) Cypress.io
5 2 (0.87%) Jenkins
5 2 (0.87%) Team Foundation Server
6 1 (0.43%) Appium
6 1 (0.43%) Cucumber
6 1 (0.43%) git-flow
6 1 (0.43%) Jasmine
6 1 (0.43%) Selenium
General
1 118 (51.30%) Social Skills
2 51 (22.17%) Analytical Skills
3 41 (17.83%) Organisational Skills
3 41 (17.83%) Retail
4 25 (10.87%) Telecoms
5 23 (10.00%) Inclusion and Diversity
5 23 (10.00%) Legal
6 22 (9.57%) Finance
7 18 (7.83%) Marketing
8 17 (7.39%) Public Sector
9 8 (3.48%) Presentation Skills
10 7 (3.04%) Law
11 6 (2.61%) Digital Healthcare
11 6 (2.61%) German Language
12 5 (2.17%) Documentation Skills
12 5 (2.17%) Pharmaceutical
13 3 (1.30%) Electronics
13 3 (1.30%) Manufacturing
13 3 (1.30%) Military
14 2 (0.87%) iGaming
Job Titles
1 33 (14.35%) Analyst
2 28 (12.17%) Service Analyst
2 28 (12.17%) Service Desk Analyst
3 26 (11.30%) Senior
4 23 (10.00%) Project Manager
5 14 (6.09%) Bid Manager
5 14 (6.09%) IT Analyst
5 14 (6.09%) IT Manager
6 13 (5.65%) IT Support
7 12 (5.22%) Developer
8 11 (4.78%) Account Manager
8 11 (4.78%) Graduate
9 9 (3.91%) Business Manager
10 8 (3.48%) Administrator
10 8 (3.48%) Architect
10 8 (3.48%) Cisco Architect
10 8 (3.48%) Graduate Account Manager
10 8 (3.48%) Senior Architect
10 8 (3.48%) Senior Cisco Architect
11 7 (3.04%) Lead
Libraries, Frameworks & Software Standards
1 16 (6.96%) OLE
2 11 (4.78%) CSS
3 10 (4.35%) HTML
4 5 (2.17%) .NET
4 5 (2.17%) .NET Framework
4 5 (2.17%) ASP.NET
4 5 (2.17%) ASP.NET MVC
4 5 (2.17%) jQuery
4 5 (2.17%) LINQ
4 5 (2.17%) Twitter Bootstrap
5 3 (1.30%) AngularJS
6 2 (0.87%) React
7 1 (0.43%) Flutter
7 1 (0.43%) HTML5
7 1 (0.43%) Keycloak
7 1 (0.43%) NestJS
7 1 (0.43%) Next.js
7 1 (0.43%) RabbitMQ
7 1 (0.43%) React Native
7 1 (0.43%) Vue
Miscellaneous
1 27 (11.74%) Management Information System
1 27 (11.74%) Smartphone
2 23 (10.00%) Driving Licence
3 19 (8.26%) Self-Motivation
4 12 (5.22%) Data Centre
5 7 (3.04%) EPoS
6 5 (2.17%) Housing Association
7 4 (1.74%) Public Cloud
8 3 (1.30%) FMCG
8 3 (1.30%) Social Media
9 2 (0.87%) Blog
9 2 (0.87%) Derivative
9 2 (0.87%) Digital Media
9 2 (0.87%) NHS
9 2 (0.87%) PMI
10 1 (0.43%) e-Learning
10 1 (0.43%) Graphic Design
10 1 (0.43%) Mobile App
10 1 (0.43%) Tandem
10 1 (0.43%) Video Conferencing
Operating Systems
1 29 (12.61%) Windows
2 17 (7.39%) Windows Server
3 10 (4.35%) Windows 10
3 10 (4.35%) Windows Server 2012
4 8 (3.48%) Linux
5 6 (2.61%) Windows 8
5 6 (2.61%) Windows Server 2008
5 6 (2.61%) Windows Server 2016
6 4 (1.74%) Unix
7 2 (0.87%) Windows Vista
8 1 (0.43%) Android
8 1 (0.43%) Apple iOS
8 1 (0.43%) Red Hat Enterprise Linux
Processes & Methodologies
1 68 (29.57%) Problem-Solving
2 59 (25.65%) Customer Service
3 38 (16.52%) CRM
4 37 (16.09%) Agile
5 31 (13.48%) Project Management
6 28 (12.17%) ITSM
7 22 (9.57%) Presales
7 22 (9.57%) Project Delivery
8 21 (9.13%) Continuous Improvement
9 19 (8.26%) People Management
10 18 (7.83%) Information Management
11 14 (6.09%) Analytics
11 14 (6.09%) Mentoring
12 13 (5.65%) Customer Engagement
12 13 (5.65%) Cybersecurity
12 13 (5.65%) Decision-Making
13 12 (5.22%) Business Development
13 12 (5.22%) Mathematics
13 12 (5.22%) Software Licensing
13 12 (5.22%) Stakeholder Management
Programming Languages
1 18 (7.83%) R
2 10 (4.35%) JavaScript
3 7 (3.04%) PowerShell
4 6 (2.61%) C#
4 6 (2.61%) Python
5 3 (1.30%) Bash
5 3 (1.30%) SQL
6 2 (0.87%) Java
6 2 (0.87%) Julia
7 1 (0.43%) Kotlin
7 1 (0.43%) Ruby
7 1 (0.43%) Swift
7 1 (0.43%) TypeScript
Qualifications
1 45 (19.57%) Degree
2 18 (7.83%) Microsoft Certification
3 14 (6.09%) APMP
4 11 (4.78%) A+ Certification
5 9 (3.91%) HND
6 8 (3.48%) CCNA
6 8 (3.48%) CCNP
6 8 (3.48%) Cisco Certification
7 7 (3.04%) Security Cleared
8 5 (2.17%) AWS Certification
8 5 (2.17%) HNC
9 4 (1.74%) AWS Certified Solutions Architect
9 4 (1.74%) BPSS Clearance
10 3 (1.30%) Network+ Certification
10 3 (1.30%) SC Cleared
11 2 (0.87%) CIPD
11 2 (0.87%) ITIL Certification
11 2 (0.87%) PMI Certification
12 1 (0.43%) PMP
Quality Assurance & Compliance
1 25 (10.87%) SLA
2 10 (4.35%) PMO
2 10 (4.35%) QA
3 9 (3.91%) ISO 9001
4 6 (2.61%) ISO/IEC 27001
5 4 (1.74%) GDPR
5 4 (1.74%) ISO 14001
6 2 (0.87%) Data Quality
7 1 (0.43%) Accessibility
7 1 (0.43%) Cyber Essentials
7 1 (0.43%) GxP
System Software
1 38 (16.52%) Active Directory
2 10 (4.35%) VMware Infrastructure
3 7 (3.04%) Hyper-V
4 6 (2.61%) Terminal Services
5 4 (1.74%) Firmware
5 4 (1.74%) Virtual Machines
6 3 (1.30%) Docker
7 2 (0.87%) VMware ESXi
7 2 (0.87%) vSphere
8 1 (0.43%) Lustre
8 1 (0.43%) Slurm Workload Manager
Systems Management
1 4 (1.74%) CASB
1 4 (1.74%) Stealthwatch
2 3 (1.30%) Microsoft Intune
3 2 (0.87%) Kubernetes
4 1 (0.43%) Ansible
4 1 (0.43%) Icinga
4 1 (0.43%) Plesk
4 1 (0.43%) Proxmox
4 1 (0.43%) Terraform
Vendors
1 103 (44.78%) Microsoft
2 28 (12.17%) Apple
3 13 (5.65%) Adobe
4 12 (5.22%) VMware
5 11 (4.78%) Virgin Media
6 10 (4.35%) Google
6 10 (4.35%) SAP
7 9 (3.91%) Cisco
7 9 (3.91%) Meraki
8 8 (3.48%) IBM
9 6 (2.61%) Avaya
9 6 (2.61%) Salesforce
10 4 (1.74%) Dell
10 4 (1.74%) HP
10 4 (1.74%) NetApp
10 4 (1.74%) Oracle
11 2 (0.87%) CA
11 2 (0.87%) Facebook
11 2 (0.87%) Twitter
12 1 (0.43%) HubSpot