Windows Server Jobs in Scotland

Microsoft Windows Server
UK > Scotland

The following table provides summary statistics for permanent job vacancies advertised in Scotland with a requirement for Windows Server skills. Included is a benchmarking guide to the salaries offered in vacancies that have cited Windows Server over the 6 months to 25 April 2024 with a comparison to the same period in the previous 2 years.

6 months to
25 Apr 2024
Same period 2023 Same period 2022
Rank 147 118 107
Rank change year-on-year -29 -11 -33
Permanent jobs citing Windows Server 154 113 156
As % of all permanent jobs advertised in Scotland 2.30% 2.38% 2.75%
As % of the Operating Systems category 18.97% 15.25% 16.25%
Number of salaries quoted 119 70 111
10th Percentile £25,200 £28,500 £23,000
25th Percentile £26,700 £36,563 £30,625
Median annual salary (50th Percentile) £42,500 £55,000 £45,000
Median % change year-on-year -22.73% +22.22% +7.14%
75th Percentile £52,500 £65,625 £53,250
90th Percentile £69,000 £80,000 £61,250
UK median annual salary £42,500 £45,000 £42,500
% change year-on-year -5.56% +5.88% -

All Operating Systems
Scotland

Windows Server is in the Operating Systems category. The following table is for comparison with the above and provides summary statistics for all permanent job vacancies advertised in Scotland with a requirement for operating system skills.

Permanent vacancies with a requirement for operating system skills 812 741 960
As % of all permanent jobs advertised in Scotland 12.11% 15.58% 16.90%
Number of salaries quoted 424 435 561
10th Percentile £25,200 £28,050 £24,250
25th Percentile £28,950 £35,000 £30,500
Median annual salary (50th Percentile) £49,245 £50,000 £50,000
Median % change year-on-year -1.51% - +5.26%
75th Percentile £61,313 £65,000 £63,750
90th Percentile £78,375 £77,715 £71,250
UK median annual salary £45,000 £52,500 £52,500
% change year-on-year -14.29% - +5.00%

Windows Server
Job Vacancy Trend in Scotland

Job postings citing Windows Server as a proportion of all IT jobs advertised in Scotland.
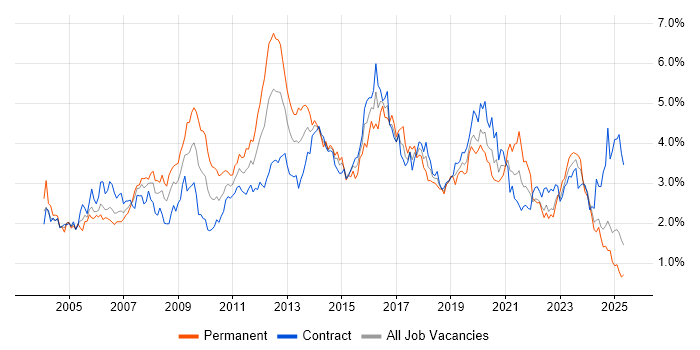
Job vacancy trend for Windows Server in Scotland

Windows Server
Salary Trend in Scotland

3-month moving average salary quoted in jobs citing Windows Server in Scotland.

Salary trend for Windows Server in Scotland

Windows Server
Salary Histogram in Scotland

Salary distribution for jobs citing Windows Server in Scotland over the 6 months to 25 April 2024.

Salary histogram for Windows Server in Scotland

Windows Server
Job Locations in Scotland

The table below looks at the demand and provides a guide to the median salaries quoted in IT jobs citing Windows Server within the Scotland region over the 6 months to 25 April 2024. The 'Rank Change' column provides an indication of the change in demand within each location based on the same 6 month period last year.

Location Rank Change
on Same Period
Last Year
Matching
Permanent
IT Job Ads
Median Salary
Past 6 Months
Median Salary
% Change
on Same Period
Last Year
Live
Jobs
Glasgow -75 59 £47,500 -9.52% 15
Edinburgh +45 55 £42,500 -32.28% 17
Argyll and Bute - 16 £27,400 - 2
Dundee -9 6 - -
Aberdeen -24 6 £55,000 -15.38% 1
East Ayrshire - 5 £24,500 - 1
Banffshire - 4 £22,000 - 1
Renfrewshire -3 1 - -
North Lanarkshire - 1 £37,500 -
Stirling - 1 £46,000 -
Windows Server
UK

Windows Server
Co-occurring Skills and Capabilities in Scotland by Category

The follow tables expand on the table above by listing co-occurrences grouped by category. The same employment type, locality and period is covered with up to 20 co-occurrences shown in each of the following categories:

Application Platforms
1 20 (12.99%) Microsoft Exchange
2 4 (2.60%) SharePoint
3 3 (1.95%) IIS
Applications
1 8 (5.19%) Microsoft Office
2 1 (0.65%) Microsoft Excel
2 1 (0.65%) Microsoft PowerPoint
Business Applications
1 13 (8.44%) Unit4 Business World
Cloud Services
1 71 (46.10%) Azure
2 60 (38.96%) Microsoft 365
3 35 (22.73%) Entra ID
4 19 (12.34%) AWS
5 17 (11.04%) IaaS
5 17 (11.04%) PaaS
6 13 (8.44%) GCP
7 9 (5.84%) Azure DevOps
8 6 (3.90%) Azure Sentinel
9 5 (3.25%) SaaS
10 4 (2.60%) Cloud Computing
10 4 (2.60%) Microsoft Purview
10 4 (2.60%) Mimecast
10 4 (2.60%) OneDrive
11 2 (1.30%) Power Platform
11 2 (1.30%) WhatsApp
Communications & Networking
1 28 (18.18%) Firewall
2 23 (14.94%) WAN
3 17 (11.04%) VPN
4 15 (9.74%) VoIP
5 14 (9.09%) SAN
6 13 (8.44%) SD-WAN
7 12 (7.79%) DNS
7 12 (7.79%) TCP/IP
8 10 (6.49%) DHCP
9 7 (4.55%) NAS
10 6 (3.90%) Cisco IOS
10 6 (3.90%) LAN
10 6 (3.90%) VLAN
10 6 (3.90%) Wireless
11 5 (3.25%) Internet
11 5 (3.25%) Network Security
12 4 (2.60%) IMAP
13 2 (1.30%) Wi-Fi
14 1 (0.65%) NetScaler
14 1 (0.65%) Remote Desktop
Database & Business Intelligence
1 30 (19.48%) SQL Server
2 13 (8.44%) DB2
3 4 (2.60%) Azure SQL Database
4 3 (1.95%) Big Data
Development Applications
1 1 (0.65%) Visual Studio
General
1 47 (30.52%) Social Skills
2 35 (22.73%) Finance
3 15 (9.74%) Public Sector
4 13 (8.44%) Legal
5 9 (5.84%) Telecoms
6 7 (4.55%) Inclusion and Diversity
6 7 (4.55%) Law
6 7 (4.55%) Organisational Skills
7 4 (2.60%) Analytical Skills
7 4 (2.60%) Billing
8 3 (1.95%) Banking
8 3 (1.95%) Documentation Skills
9 2 (1.30%) Police
Job Titles
1 27 (17.53%) IT Manager
2 26 (16.88%) Senior
3 24 (15.58%) Infrastructure Engineer
4 19 (12.34%) 2nd Line Support
4 19 (12.34%) Infrastructure Support
4 19 (12.34%) IT Support
5 15 (9.74%) Cloud Engineer
5 15 (9.74%) IT Engineer
6 14 (9.09%) Systems Engineer
7 11 (7.14%) Analyst
8 9 (5.84%) Audit Manager
8 9 (5.84%) IT Audit Manager
8 9 (5.84%) Support Engineer
9 8 (5.19%) Support Analyst
10 7 (4.55%) Help Desk Technician
10 7 (4.55%) IT Analyst
10 7 (4.55%) IT Support Analyst
10 7 (4.55%) Senior Infrastructure Engineer
11 6 (3.90%) IT Support Technician
11 6 (3.90%) IT Technician
Libraries, Frameworks & Software Standards
1 1 (0.65%) .NET
1 1 (0.65%) ASP.NET
1 1 (0.65%) REST
Miscellaneous
1 16 (10.39%) Data Centre
2 14 (9.09%) Driving Licence
2 14 (9.09%) Public Cloud
3 13 (8.44%) Replication
4 4 (2.60%) Learning Management System
4 4 (2.60%) Private Cloud
5 2 (1.30%) Onboarding
6 1 (0.65%) Device Driver
6 1 (0.65%) Self-Motivation
Operating Systems
1 154 (100.00%) Windows
2 45 (29.22%) Linux
3 18 (11.69%) Windows 10
4 13 (8.44%) Unix
5 9 (5.84%) Windows Server 2012
5 9 (5.84%) Windows Server 2016
6 8 (5.19%) CentOS
7 6 (3.90%) Android
8 5 (3.25%) Windows Server 2019
9 4 (2.60%) Windows Server 2008
10 3 (1.95%) Debian
11 2 (1.30%) Windows 8
12 1 (0.65%) Mac OS X
12 1 (0.65%) Windows 7
Processes & Methodologies
1 43 (27.92%) Infrastructure Engineering
2 26 (16.88%) Mentoring
3 24 (15.58%) Disaster Recovery
4 22 (14.29%) DevOps
5 19 (12.34%) ITIL
5 19 (12.34%) Problem-Solving
6 17 (11.04%) IT Audit
7 16 (10.39%) Agile
7 16 (10.39%) Cybersecurity
7 16 (10.39%) Project Delivery
8 14 (9.09%) Project Management
9 13 (8.44%) Analytics
9 13 (8.44%) Creative Thinking
9 13 (8.44%) Data Analytics
9 13 (8.44%) Data Privacy
9 13 (8.44%) ERP
9 13 (8.44%) Network Virtualisation
9 13 (8.44%) Technical Analysis
10 11 (7.14%) Mobile Device Management
11 10 (6.49%) Continuous Improvement
Programming Languages
1 26 (16.88%) SQL
2 14 (9.09%) PowerShell
3 10 (6.49%) Bash
4 1 (0.65%) C#
Qualifications
1 33 (21.43%) Degree
2 21 (13.64%) Security Cleared
3 19 (12.34%) DV Cleared
4 14 (9.09%) CCNA
4 14 (9.09%) Cisco Certification
5 13 (8.44%) CISA
6 8 (5.19%) Microsoft Certification
7 7 (4.55%) Computer Science Degree
8 6 (3.90%) MCSE
9 5 (3.25%) Azure Certification
10 4 (2.60%) CISM
10 4 (2.60%) CISSP
11 3 (1.95%) MCSA
11 3 (1.95%) RHCT
12 2 (1.30%) SC Cleared
13 1 (0.65%) CCNP
13 1 (0.65%) VMware Certified Professional (VCP)
Quality Assurance & Compliance
1 13 (8.44%) ITGC
1 13 (8.44%) PMO
2 4 (2.60%) GDPR
2 4 (2.60%) ISO/IEC 27001
2 4 (2.60%) NIST
2 4 (2.60%) SLA
3 1 (0.65%) QA
System Software
1 95 (61.69%) Active Directory
2 46 (29.87%) VMware Infrastructure
3 20 (12.99%) Hyper-V
4 13 (8.44%) VMware NSX
5 6 (3.90%) Virtual Machines
6 3 (1.95%) KVM
6 3 (1.95%) pfSense
6 3 (1.95%) vSphere
7 1 (0.65%) Virtual Desktop
7 1 (0.65%) VMware ESXi
7 1 (0.65%) XenDesktop
Systems Management
1 23 (14.94%) Ansible
1 23 (14.94%) Terraform
2 20 (12.99%) Microsoft Intune
3 13 (8.44%) FortiGate
4 8 (5.19%) SCCM
5 7 (4.55%) ZABBIX
6 4 (2.60%) Grafana
6 4 (2.60%) Kubernetes
6 4 (2.60%) Prometheus
7 1 (0.65%) SCOM
7 1 (0.65%) vCenter Server
Vendors
1 64 (41.56%) Microsoft
1 64 (41.56%) VMware
2 27 (17.53%) Cisco
3 13 (8.44%) NetApp
3 13 (8.44%) Oracle
3 13 (8.44%) Sage
3 13 (8.44%) SAP
4 10 (6.49%) Citrix
5 7 (4.55%) Mitel
6 6 (3.90%) EMC
6 6 (3.90%) Sophos
7 5 (3.25%) ConnectWise
8 4 (2.60%) Aderant
8 4 (2.60%) Apple
8 4 (2.60%) Dell
8 4 (2.60%) HP
8 4 (2.60%) iManage
9 3 (1.95%) Red Hat
9 3 (1.95%) TP-LINK
10 2 (1.30%) ServiceNow