Linux Jobs in the South East

Linux
England > South East

The following table provides summary statistics for permanent job vacancies advertised in the South East with a requirement for Linux skills. Included is a benchmarking guide to the salaries offered in vacancies that have cited Linux over the 6 months to 30 November 2023 with a comparison to the same period in the previous 2 years.

6 months to
30 Nov 2023
Same period 2022 Same period 2021
Rank 21 31 26
Rank change year-on-year +10 -5 -4
Permanent jobs citing Linux 719 1,348 1,775
As % of all permanent jobs advertised in the South East 9.27% 7.72% 9.61%
As % of the Operating Systems category 41.51% 41.27% 47.46%
Number of salaries quoted 470 861 1,111
10th Percentile £32,500 £32,500 £32,500
25th Percentile £38,750 £40,000 £39,625
Median annual salary (50th Percentile) £52,500 £52,500 £52,500
Median % change year-on-year - - +5.00%
75th Percentile £65,000 £67,500 £68,750
90th Percentile £82,500 £78,750 £77,500
England median annual salary £60,000 £62,500 £60,000
% change year-on-year -4.00% +4.17% +9.09%

All Operating Systems
South East

Linux is in the Operating Systems category. The following table is for comparison with the above and provides summary statistics for all permanent job vacancies advertised in the South East with a requirement for operating system skills.

Permanent vacancies with a requirement for operating system skills 1,732 3,266 3,740
As % of all permanent jobs advertised in the South East 22.33% 18.71% 20.25%
Number of salaries quoted 1,327 2,414 2,613
10th Percentile £26,250 £26,250 £25,750
25th Percentile £31,500 £31,250 £32,588
Median annual salary (50th Percentile) £45,000 £45,000 £47,500
Median % change year-on-year - -5.26% +3.26%
75th Percentile £57,500 £62,500 £62,500
90th Percentile £71,100 £76,250 £73,750
England median annual salary £50,000 £52,500 £50,000
% change year-on-year -4.76% +5.00% -

Linux
Job Vacancy Trend in the South East

Job postings citing Linux as a proportion of all IT jobs advertised in the South East.
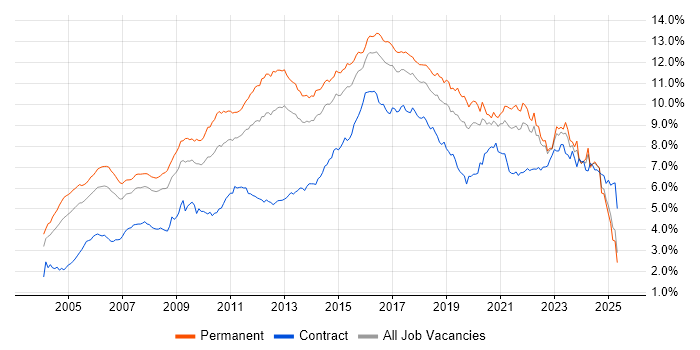
Job vacancy trend for Linux in the South East

Linux
Salary Trend in the South East

3-month moving average salary quoted in jobs citing Linux in the South East.

Salary trend for Linux in the South East

Linux
Salary Histogram in the South East

Salary distribution for jobs citing Linux in the South East over the 6 months to 30 November 2023.

Salary histogram for Linux in the South East

Linux
Job Locations in the South East

The table below looks at the demand and provides a guide to the median salaries quoted in IT jobs citing Linux within the South East region over the 6 months to 30 November 2023. The 'Rank Change' column provides an indication of the change in demand within each location based on the same 6 month period last year.

Location Rank Change
on Same Period
Last Year
Matching
Permanent
IT Job Ads
Median Salary
Past 6 Months
Median Salary
% Change
on Same Period
Last Year
Live
Jobs
Thames Valley +15 414 £52,500 -4.55% 101
Berkshire +7 266 £52,500 -8.70% 46
Hampshire +6 184 £52,500 +5.00% 52
Buckinghamshire +21 105 £63,750 +21.43% 17
Surrey +3 68 £52,500 - 51
Oxfordshire +10 43 £42,796 -22.19% 38
Kent +42 27 £55,000 +29.41% 5
West Sussex +9 17 £56,250 +7.14% 10
East Sussex -14 6 £35,750 -31.90% 7
M4 Corridor - 1 £95,000 -
Linux
England

Linux
Co-occurring Skills and Capabilities in the South East by Category

The follow tables expand on the table above by listing co-occurrences grouped by category. The same employment type, locality and period is covered with up to 20 co-occurrences shown in each of the following categories:

Application Platforms
1 24 (3.34%) IIS
2 18 (2.50%) Apache
3 14 (1.95%) nginx
4 11 (1.53%) Confluence
5 8 (1.11%) Oracle Service Bus
5 8 (1.11%) WebLogic
6 7 (0.97%) WebSphere
7 6 (0.83%) Tomcat
8 5 (0.70%) SharePoint
9 4 (0.56%) OpenStack
10 2 (0.28%) MS Exchange
10 2 (0.28%) Red Hat Fuse
11 1 (0.14%) CICS
11 1 (0.14%) WordPress
Applications
1 15 (2.09%) Microsoft Office
2 11 (1.53%) Simulink
3 8 (1.11%) Microsoft Excel
3 8 (1.11%) MS Visio
4 4 (0.56%) OrCAD
5 1 (0.14%) Mathcad
Business Applications
1 8 (1.11%) Remedy ITSM
2 2 (0.28%) Oracle Procure-to-Pay
3 1 (0.14%) Sage X3
3 1 (0.14%) Sparx Enterprise Architect
Cloud Services
1 159 (22.11%) Azure
2 131 (18.22%) AWS
3 44 (6.12%) Azure DevOps
4 40 (5.56%) Microsoft 365
5 37 (5.15%) GCP
6 33 (4.59%) Serverless
7 26 (3.62%) SaaS
8 21 (2.92%) AWS Lambda
9 19 (2.64%) GitHub
10 18 (2.50%) AWS CloudFormation
11 13 (1.81%) Amazon EC2
11 13 (1.81%) Amazon EKS
12 12 (1.67%) Amazon S3
13 11 (1.53%) OpenShift
14 10 (1.39%) PaaS
15 9 (1.25%) AWS CodeBuild
16 8 (1.11%) Cloud Computing
16 8 (1.11%) IaaS
17 7 (0.97%) Virtual Private Cloud
18 6 (0.83%) Amazon Kinesis
Communications & Networking
1 117 (16.27%) TCP/IP
2 100 (13.91%) DNS
3 79 (10.99%) DHCP
4 64 (8.90%) Firewall
5 53 (7.37%) HTTP
6 29 (4.03%) SAN
7 26 (3.62%) SNMP
8 19 (2.64%) Network Security
9 15 (2.09%) Wireless
10 13 (1.81%) WAN
11 11 (1.53%) Ethernet
11 11 (1.53%) Internet
11 11 (1.53%) LAN
11 11 (1.53%) VPN
12 9 (1.25%) Intrusion Detection
12 9 (1.25%) SSL
12 9 (1.25%) VoIP
13 6 (0.83%) VLAN
14 5 (0.70%) Broadband
14 5 (0.70%) NAS
Database & Business Intelligence
1 54 (7.51%) MySQL
2 20 (2.78%) SQL Server
3 19 (2.64%) PostgreSQL
4 17 (2.36%) Relational Database
5 14 (1.95%) DB2
6 11 (1.53%) Oracle Database
7 9 (1.25%) Amazon RDS
8 8 (1.11%) Amazon Athena
8 8 (1.11%) DynamoDB
8 8 (1.11%) NoSQL
8 8 (1.11%) Oracle Database 10g
8 8 (1.11%) Oracle Database 11g
8 8 (1.11%) VLDB
9 6 (0.83%) Elasticsearch
10 5 (0.70%) Big Data
11 4 (0.56%) GIS
11 4 (0.56%) InfluxDB
11 4 (0.56%) MongoDB
12 3 (0.42%) MariaDB
12 3 (0.42%) RDBMS
Development Applications
1 74 (10.29%) Git
2 60 (8.34%) Jenkins
3 44 (6.12%) JIRA
4 34 (4.73%) Selenium
5 25 (3.48%) Robot Framework
6 20 (2.78%) GitLab
7 15 (2.09%) Artifactory
8 13 (1.81%) SonarQube
8 13 (1.81%) Subversion
9 12 (1.67%) CMake
10 11 (1.53%) Maven
10 11 (1.53%) MSI
11 9 (1.25%) JMeter
12 8 (1.11%) CircleCI
12 8 (1.11%) git-flow
12 8 (1.11%) Gradle
12 8 (1.11%) SoapUI
12 8 (1.11%) Team Foundation Server
12 8 (1.11%) TestLink
12 8 (1.11%) Visual Studio
General
1 184 (25.59%) Social Skills
2 71 (9.87%) Inclusion and Diversity
3 61 (8.48%) Analytical Skills
4 49 (6.82%) Manufacturing
5 42 (5.84%) Finance
6 40 (5.56%) Electronics
7 18 (2.50%) Public Sector
7 18 (2.50%) Telecoms
8 16 (2.23%) Presentation Skills
9 15 (2.09%) Military
10 11 (1.53%) Aerospace
11 10 (1.39%) Marketing
12 9 (1.25%) Aviation
12 9 (1.25%) Organisational Skills
13 8 (1.11%) Billing
14 7 (0.97%) Back Office
14 7 (0.97%) Retail
15 5 (0.70%) Financial Institution
16 4 (0.56%) Law
16 4 (0.56%) Legal
Job Titles
1 110 (15.30%) Software Engineer
2 103 (14.33%) Senior
3 102 (14.19%) Infrastructure Engineer
4 92 (12.80%) Analyst
5 68 (9.46%) Support Engineer
6 59 (8.21%) Linux Engineer
6 59 (8.21%) Systems Engineer
7 50 (6.95%) DevOps Engineer
8 47 (6.54%) Developer
9 46 (6.40%) Applications Engineer
10 45 (6.26%) Embedded Engineer
11 44 (6.12%) Embedded Software Engineer
12 42 (5.84%) Junior
13 33 (4.59%) Applications Support
14 28 (3.89%) Administrator
15 26 (3.62%) Solutions Analyst
15 26 (3.62%) Windows Engineer
16 25 (3.48%) Architect
17 24 (3.34%) Windows Systems Engineer
18 23 (3.20%) Graduate
Libraries, Frameworks & Software Standards
1 29 (4.03%) HTML
1 29 (4.03%) Protocol Buffers
2 26 (3.62%) REST
3 20 (2.78%) Elastic Stack
4 18 (2.50%) CSS
4 18 (2.50%) XML
5 17 (2.36%) RabbitMQ
6 13 (1.81%) React
6 13 (1.81%) Yocto
7 12 (1.67%) .NET
8 11 (1.53%) Node.js
8 11 (1.53%) STL
9 10 (1.39%) LAMP
9 10 (1.39%) Qt
10 9 (1.25%) Spring
10 9 (1.25%) YAML
11 8 (1.11%) Blazor
11 8 (1.11%) JSON
11 8 (1.11%) WebAssembly
11 8 (1.11%) WinForms
Miscellaneous
1 32 (4.45%) Algorithms
2 27 (3.76%) Embedded Systems
3 26 (3.62%) CMDB
4 24 (3.34%) Client/Server
5 22 (3.06%) Self-Motivation
6 20 (2.78%) IoT
7 19 (2.64%) Public Cloud
8 18 (2.50%) Linux Command Line
8 18 (2.50%) PKI
9 17 (2.36%) Raspberry Pi
10 15 (2.09%) Data Centre
10 15 (2.09%) Management Information System
11 14 (1.95%) Clustering
12 13 (1.81%) Enterprise Software
13 12 (1.67%) Security Operations Centre
14 11 (1.53%) FPGA
14 11 (1.53%) VHDL
15 9 (1.25%) Video\Live Streaming
16 8 (1.11%) Arduino
16 8 (1.11%) Legacy Systems
Operating Systems
1 345 (47.98%) Windows
2 140 (19.47%) Windows Server
3 88 (12.24%) Unix
4 85 (11.82%) Red Hat Enterprise Linux
5 83 (11.54%) Android
6 40 (5.56%) CentOS
7 27 (3.76%) Ubuntu
8 21 (2.92%) Windows Server 2019
9 18 (2.50%) Windows 10
10 17 (2.36%) Windows Server 2016
11 15 (2.09%) Windows Server 2012
12 12 (1.67%) Embedded Linux
13 11 (1.53%) Debian
14 10 (1.39%) Solaris
15 9 (1.25%) Mac OS
16 5 (0.70%) Apple iOS
16 5 (0.70%) Windows XP
17 4 (0.56%) Data ONTAP
17 4 (0.56%) Rocky
17 4 (0.56%) VxWorks
Processes & Methodologies
1 143 (19.89%) Agile
2 136 (18.92%) DevOps
3 133 (18.50%) Software Engineering
4 120 (16.69%) Problem-Solving
5 114 (15.86%) Infrastructure Engineering
6 95 (13.21%) Configuration Management
7 79 (10.99%) CI/CD
8 78 (10.85%) Infrastructure as Code
9 68 (9.46%) Functional Testing
10 67 (9.32%) Actionable Insight
10 67 (9.32%) Mathematics
11 65 (9.04%) Project Planning
12 64 (8.90%) Software Testing
13 62 (8.62%) Continuous Integration
14 57 (7.93%) Computer Science
15 54 (7.51%) Mentoring
16 51 (7.09%) ITIL
17 49 (6.82%) Unit Testing
18 47 (6.54%) Test Automation
19 43 (5.98%) Release Management
Programming Languages
1 264 (36.72%) Python
2 121 (16.83%) C
3 110 (15.30%) PowerShell
4 103 (14.33%) C++
5 100 (13.91%) SQL
6 92 (12.80%) Bash
7 83 (11.54%) Java
8 46 (6.40%) Perl
9 43 (5.98%) PHP
10 40 (5.56%) JavaScript
11 33 (4.59%) Shell Script
12 27 (3.76%) VBScript
13 26 (3.62%) PL/SQL
14 23 (3.20%) C#
15 21 (2.92%) Fortran
16 18 (2.50%) MATLAB
17 16 (2.23%) Go
18 15 (2.09%) Groovy
19 11 (1.53%) Ruby
20 7 (0.97%) Rust
Qualifications
1 252 (35.05%) Security Cleared
2 177 (24.62%) Degree
3 147 (20.45%) SC Cleared
4 70 (9.74%) DV Cleared
5 48 (6.68%) Cisco Certification
6 39 (5.42%) Microsoft Certification
7 37 (5.15%) MCSE
8 34 (4.73%) Linux+ Certification
9 33 (4.59%) Computer Science Degree
10 20 (2.78%) Master's Degree
11 18 (2.50%) PhD
12 15 (2.09%) AWS Certification
13 12 (1.67%) CCNA
14 6 (0.83%) CISSP
14 6 (0.83%) HNC
15 5 (0.70%) AWS Certified Developer
15 5 (0.70%) Azure Certification
15 5 (0.70%) CCNP
16 4 (0.56%) BPSS Clearance
16 4 (0.56%) CTC Cleared
Quality Assurance & Compliance
1 18 (2.50%) QA
2 16 (2.23%) ISO/IEC 27001
3 14 (1.95%) SLA
4 7 (0.97%) GDPR
5 4 (0.56%) NIST
5 4 (0.56%) PMO
6 3 (0.42%) ISO/IEC 27002 (supersedes ISO/IEC 17799)
7 2 (0.28%) Accessibility
7 2 (0.28%) Government Security Classifications
7 2 (0.28%) NCSC
7 2 (0.28%) PCI DSS
8 1 (0.14%) Cyber Essentials
8 1 (0.14%) Data Quality
8 1 (0.14%) ECSS
8 1 (0.14%) IEC 61508
8 1 (0.14%) ISO 9001
8 1 (0.14%) ISO/IEC 20000
8 1 (0.14%) MISRA
System Software
1 110 (15.30%) Active Directory
2 95 (13.21%) VMware Infrastructure
3 68 (9.46%) Docker
4 30 (4.17%) Hyper-V
5 29 (4.03%) VMware ESXi
6 17 (2.36%) Firmware
7 16 (2.23%) vSphere
8 9 (1.25%) Virtual Machines
9 8 (1.11%) Oracle RAC
10 5 (0.70%) KVM
11 4 (0.56%) Citrix Hypervisor
11 4 (0.56%) GPFS
11 4 (0.56%) Tivoli Workload Scheduler
11 4 (0.56%) Virtual Servers
11 4 (0.56%) VMware NSX
12 2 (0.28%) LXC
12 2 (0.28%) Microsoft Virtual Server
12 2 (0.28%) Veritas Cluster Server
13 1 (0.14%) Ceph
13 1 (0.14%) Kamailio
Systems Management
1 134 (18.64%) Terraform
2 132 (18.36%) Ansible
3 72 (10.01%) Kubernetes
4 67 (9.32%) Puppet
5 38 (5.29%) SCOM
6 30 (4.17%) SCCM
7 23 (3.20%) vCenter Server
8 18 (2.50%) Tivoli
9 16 (2.23%) Red Hat Satellite
10 11 (1.53%) Packer
10 11 (1.53%) Tivoli Storage Manager
11 9 (1.25%) Progress Chef
12 8 (1.11%) Data Guard
12 8 (1.11%) Microsoft Intune
12 8 (1.11%) Oracle RMAN
13 7 (0.97%) Rancher
13 7 (0.97%) ZABBIX
14 6 (0.83%) EMC NetWorker
14 6 (0.83%) Nagios
14 6 (0.83%) WSUS
Vendors
1 142 (19.75%) Microsoft
2 136 (18.92%) VMware
3 55 (7.65%) Cisco
4 47 (6.54%) Apple
4 47 (6.54%) Red Hat
5 30 (4.17%) Oracle
6 27 (3.76%) Dynatrace
7 17 (2.36%) IBM
7 17 (2.36%) Veeam
8 14 (1.95%) Veritas
9 11 (1.53%) Google
9 11 (1.53%) ServiceNow
9 11 (1.53%) Splunk
9 11 (1.53%) Sun
10 10 (1.39%) AppDynamics
10 10 (1.39%) EMC
10 10 (1.39%) Juniper
10 10 (1.39%) NetApp
10 10 (1.39%) SAP
11 9 (1.25%) Xilinx