Legal Jobs in the West Midlands

Legal
England > West Midlands

The table below looks at the prevalence of the term Legal in permanent job vacancies in the West Midlands. Included is a benchmarking guide to the salaries offered in vacancies that cited Legal over the 6 months leading up to 14 May 2025, comparing them to the same period in the previous two years.

6 months to
14 May 2025
Same period 2024 Same period 2023
Rank 80 70 81
Rank change year-on-year -10 +11 +52
Permanent jobs citing Legal 135 248 251
As % of all permanent jobs advertised in the West Midlands 3.14% 3.37% 3.92%
As % of the General category 5.56% 5.82% 5.15%
Number of salaries quoted 43 126 157
10th Percentile £29,450 £23,750 £31,250
25th Percentile £31,250 £25,563 £41,250
Median annual salary (50th Percentile) £40,000 £52,325 £52,500
Median % change year-on-year -23.55% -0.33% +14.13%
75th Percentile £58,250 £61,875 £68,750
90th Percentile £73,500 £75,772 £80,500
England median annual salary £57,500 £51,500 £55,000
% change year-on-year +11.65% -6.36% -

All General Skills
West Midlands

Legal falls under the General Skills category. For comparison with the information above, the following table provides summary statistics for all permanent job vacancies requiring common skills in the West Midlands.

Permanent vacancies with a requirement for common skills 2,429 4,261 4,873
As % of all permanent jobs advertised in the West Midlands 56.55% 57.82% 76.03%
Number of salaries quoted 1,063 3,024 2,229
10th Percentile £28,050 £25,500 £29,750
25th Percentile £36,250 £32,500 £37,500
Median annual salary (50th Percentile) £52,500 £47,500 £52,500
Median % change year-on-year +10.53% -9.52% +9.38%
75th Percentile £65,000 £62,500 £67,500
90th Percentile £77,500 £75,000 £77,500
England median annual salary £57,500 £52,500 £60,000
% change year-on-year +9.52% -12.50% -

Legal
Job Vacancy Trend in the West Midlands

Job postings citing Legal as a proportion of all IT jobs advertised in the West Midlands.
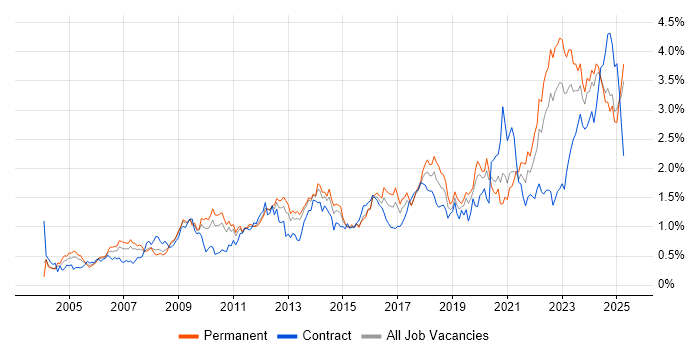
Job vacancy trend for Legal in the West Midlands

Legal
Salary Trend in the West Midlands

3-month moving average salary quoted in jobs citing Legal in the West Midlands.

Salary trend for Legal in the West Midlands

Legal
Salary Histogram in the West Midlands

Salary distribution for jobs citing Legal in the West Midlands over the 6 months to 14 May 2025.

Salary histogram for Legal in the West Midlands

Legal
Job Locations in the West Midlands

The table below looks at the demand and provides a guide to the median salaries quoted in IT jobs citing Legal within the West Midlands region over the 6 months to 14 May 2025. The 'Rank Change' column provides an indication of the change in demand within each location based on the same 6 month period last year.

Location Rank Change
on Same Period
Last Year
Matching
Permanent
IT Job Ads
Median Salary
Past 6 Months
Median Salary
% Change
on Same Period
Last Year
Live
Jobs
Warwickshire -11 47 £34,000 +41.67% 27
Birmingham -12 38 £57,500 +4.55% 66
Staffordshire +38 17 £75,724 +191.24% 32
Coventry +1 9 - - 10
Walsall - 7 £32,500 -
Solihull +5 3 £40,000 +45.45% 3
Willenhall - 3 - -
Wolverhampton +8 1 - - 3
Herefordshire +6 1 - - 2
Worcestershire +4 1 - - 10
Shropshire -3 1 £37,500 -25.00% 9
Legal
England

Legal
Co-occurring Skills and Capabilities in the West Midlands by Category

The follow tables expand on the table above by listing co-occurrences grouped by category. The same employment type, locality and period is covered with up to 20 co-occurrences shown in each of the following categories:

Application Platforms
1 17 (12.59%) SharePoint
2 4 (2.96%) CMS
2 4 (2.96%) Microsoft Exchange
3 1 (0.74%) SAS
Applications
1 33 (24.44%) Microsoft Office
2 9 (6.67%) Microsoft PowerPoint
3 8 (5.93%) Microsoft Excel
4 3 (2.22%) Microsoft Project
Business Applications
1 1 (0.74%) Elite 3E
1 1 (0.74%) Remedy ITSM
1 1 (0.74%) SAP MDG
1 1 (0.74%) SAP S/4HANA
Cloud Services
1 21 (15.56%) Microsoft 365
2 16 (11.85%) Azure
3 12 (8.89%) Power Platform
4 10 (7.41%) PowerApps
5 6 (4.44%) Entra ID
6 5 (3.70%) Power Automate
7 4 (2.96%) OneDrive
8 3 (2.22%) SaaS
9 1 (0.74%) AWS
9 1 (0.74%) GCP
9 1 (0.74%) ShareGate
Communications & Networking
1 7 (5.19%) VLAN
2 3 (2.22%) Network Security
3 2 (1.48%) Firewall
3 2 (1.48%) Intranet
3 2 (1.48%) MPLS
3 2 (1.48%) VoIP
3 2 (1.48%) Wireless
4 1 (0.74%) Cisco IPT
4 1 (0.74%) Remote Desktop
Database & Business Intelligence
1 4 (2.96%) Power BI
2 1 (0.74%) BusinessObjects
Development Applications
1 16 (11.85%) JIRA
1 16 (11.85%) Rational DOORS
2 1 (0.74%) LSMW
General
1 48 (35.56%) Documentation Skills
2 45 (33.33%) Finance
3 41 (30.37%) Social Skills
4 30 (22.22%) Manufacturing
5 20 (14.81%) Marketing
6 17 (12.59%) Law
7 7 (5.19%) Inclusion and Diversity
7 7 (5.19%) Influencing Skills
8 6 (4.44%) Automotive
9 4 (2.96%) Financial Institution
9 4 (2.96%) Prime Brokerage
9 4 (2.96%) Public Sector
10 3 (2.22%) Telecoms
11 2 (1.48%) Analytical Skills
11 2 (1.48%) Banking
11 2 (1.48%) Retail
12 1 (0.74%) Organisational Skills
12 1 (0.74%) Presentation Skills
Job Titles
1 47 (34.81%) Senior
2 18 (13.33%) Customer Executive
3 10 (7.41%) IT Support
4 6 (4.44%) Development Manager
4 6 (4.44%) SharePoint Support
5 5 (3.70%) Analyst
6 4 (2.96%) Risk Manager
7 3 (2.22%) 2nd Line Support
7 3 (2.22%) Consultant
7 3 (2.22%) Microsoft 365 Expert
7 3 (2.22%) Network Engineer
7 3 (2.22%) Security Analyst
7 3 (2.22%) Security Engineer
7 3 (2.22%) Systems Engineer
8 2 (1.48%) Architect
8 2 (1.48%) Cybersecurity Practitioner
8 2 (1.48%) Information Security Advisor
8 2 (1.48%) Information Security Analyst
8 2 (1.48%) IT Manager
8 2 (1.48%) Security Advisor
Miscellaneous
1 6 (4.44%) Social Media
2 4 (2.96%) Blockchain
2 4 (2.96%) CCTV
2 4 (2.96%) Derivative
2 4 (2.96%) Hedge funds
2 4 (2.96%) Management Information System
3 3 (2.22%) Cyberattack
3 3 (2.22%) Data Protection Act
3 3 (2.22%) e-Learning
3 3 (2.22%) SCADA
3 3 (2.22%) Security Posture
4 2 (1.48%) Graphic Design
4 2 (1.48%) Onboarding
4 2 (1.48%) Renewable Energy
5 1 (0.74%) CESG
5 1 (0.74%) Cyber Threat
5 1 (0.74%) FMCG
5 1 (0.74%) Replication
5 1 (0.74%) Self-Motivation
5 1 (0.74%) Virtual Team
Operating Systems
1 22 (16.30%) Windows
2 8 (5.93%) Windows Server
3 7 (5.19%) Windows 10
4 6 (4.44%) Windows Vista
5 2 (1.48%) Linux
6 1 (0.74%) Windows Server 2016
6 1 (0.74%) Windows Server 2019
Processes & Methodologies
1 32 (23.70%) Mathematics
2 21 (15.56%) Decision-Making
3 18 (13.33%) Business Development
3 18 (13.33%) Collaborative Working
3 18 (13.33%) Contract Negotiation
3 18 (13.33%) Data-Driven Decision Making
4 16 (11.85%) Hazard Analysis
4 16 (11.85%) Safety Engineering
4 16 (11.85%) Systems Engineering
5 11 (8.15%) Cybersecurity
5 11 (8.15%) Project Delivery
5 11 (8.15%) Risk Management
6 9 (6.67%) Case Management
6 9 (6.67%) Creative Thinking
6 9 (6.67%) Information Security
6 9 (6.67%) Project Management
7 8 (5.93%) ITIL
8 7 (5.19%) Change Management
8 7 (5.19%) Contract Management
8 7 (5.19%) Problem-Solving
Programming Languages
1 7 (5.19%) PowerShell
2 2 (1.48%) PHP
2 2 (1.48%) Shell Script
2 2 (1.48%) SQL
3 1 (0.74%) Python
Qualifications
1 46 (34.07%) BPSS Clearance
2 43 (31.85%) Degree
3 30 (22.22%) Numerate Degree
4 9 (6.67%) DBS Check
5 8 (5.93%) Security Cleared
6 6 (4.44%) SC Cleared
7 5 (3.70%) CISM
8 3 (2.22%) CISSP
9 2 (1.48%) CASP
9 2 (1.48%) Chartered Engineer
9 2 (1.48%) CompTIA Security+
9 2 (1.48%) HNC
9 2 (1.48%) HND
9 2 (1.48%) ISEB
9 2 (1.48%) Master's Degree
10 1 (0.74%) AWS Certification
10 1 (0.74%) CESG Certified Professional
10 1 (0.74%) Computer Science Degree
10 1 (0.74%) CRISC
10 1 (0.74%) TOGAF Certification
Quality Assurance & Compliance
1 11 (8.15%) ISO/IEC 27001
2 10 (7.41%) GDPR
3 6 (4.44%) NIST
4 4 (2.96%) California Consumer Privacy Act
5 3 (2.22%) Cyber Essentials
5 3 (2.22%) NCSC
6 2 (1.48%) ISO/IEC 27002 (supersedes ISO/IEC 17799)
6 2 (1.48%) PCI DSS
7 1 (0.74%) COBIT
7 1 (0.74%) GRC
7 1 (0.74%) QA
7 1 (0.74%) SOC 2
System Software
1 15 (11.11%) Active Directory
2 3 (2.22%) vSphere
3 1 (0.74%) Virtual Machines
3 1 (0.74%) VMware Infrastructure
Systems Management
1 2 (1.48%) Cisco CUCM
2 1 (0.74%) Microsoft Intune
2 1 (0.74%) Terraform
Vendors
1 30 (22.22%) Microsoft
2 18 (13.33%) Salesforce
3 4 (2.96%) VMware
4 2 (1.48%) Cisco
4 2 (1.48%) Facebook
4 2 (1.48%) YouTube
5 1 (0.74%) BMC
5 1 (0.74%) Citrix
5 1 (0.74%) Google
5 1 (0.74%) iManage
5 1 (0.74%) Intapp
5 1 (0.74%) Remedy
5 1 (0.74%) SAP
5 1 (0.74%) ServiceNow