Workflow Analysis Jobs with Work from Home Options

Workflow Analysis
UK > Work from Home

The table below provides summary statistics for permanent job vacancies with an option to work from home (WFH) and a requirement for Workflow Analysis skills. Included is a benchmarking guide to the salaries offered in vacancies that have cited Workflow Analysis over the 6 months to 28 May 2024 with a comparison to the same period in the previous 2 years.

6 months to
28 May 2024
Same period 2023 Same period 2022
Rank 568 626 838
Rank change year-on-year +58 +212 -268
Permanent jobs citing Workflow Analysis 17 26 31
As % of all permanent jobs with a WFH option 0.049% 0.065% 0.042%
As % of the Processes & Methodologies category 0.055% 0.068% 0.044%
Number of salaries quoted 16 15 27
10th Percentile £41,250 £43,500 -
25th Percentile £41,438 £48,750 £38,750
Median annual salary (50th Percentile) £43,865 £62,500 £50,000
Median % change year-on-year -29.82% +25.00% +0.10%
75th Percentile £70,000 £70,375 £54,875
90th Percentile £77,750 £74,500 £69,900
UK median annual salary £43,865 £55,000 £45,000
% change year-on-year -20.25% +22.22% -40.00%

All Process and Methodology Skills
Work from Home

Workflow Analysis is in the Processes and Methodologies category. The following table is for comparison with the above and provides summary statistics for all permanent job vacancies with a WFH option and a requirement for process or methodology skills.

Permanent vacancies with a requirement for process or methodology skills 31,100 38,207 71,189
As % of all permanent jobs with a WFH option 90.53% 96.06% 97.13%
Number of salaries quoted 23,476 26,508 41,843
10th Percentile £33,750 £37,500 £36,250
25th Percentile £42,500 £47,500 £46,000
Median annual salary (50th Percentile) £57,500 £62,621 £60,000
Median % change year-on-year -8.18% +4.37% +9.09%
75th Percentile £75,000 £82,500 £80,000
90th Percentile £95,000 £100,000 £95,000
UK median annual salary £55,000 £61,000 £60,000
% change year-on-year -9.84% +1.67% +9.09%

Workflow Analysis
Trend for Jobs with a WFH Option

Job vacancies with a work from home option citing Workflow Analysis as a proportion of all IT jobs advertised.
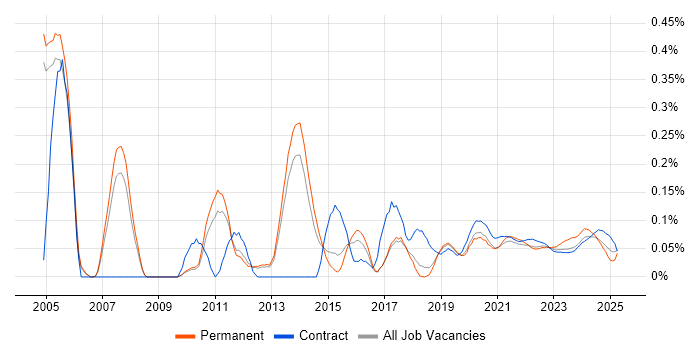
Workflow Analysis trend for jobs with a WFH option

Workflow Analysis
Salary Trend for Jobs with a WFH Option

3-month moving average salary quoted in job vacancies with a work from home option citing Workflow Analysis.

Workflow Analysis salary trend for jobs with a WFH option

Workflow Analysis
Salary Histogram for Jobs with a WFH Option

Salary distribution for jobs with a work from home option citing Workflow Analysis over the 6 months to 28 May 2024.

Workflow Analysis salary histogram for jobs with a WFH option

Workflow Analysis
Co-occurring Skills and Capabilities with WFH Options by Category

The follow tables expand on the table above by listing co-occurrences grouped by category. The same employment type, locality and period is covered with up to 20 co-occurrences shown in each of the following categories:

Application Platforms
1 5 (29.41%) SharePoint
2 3 (17.65%) Confluence
Applications
1 8 (47.06%) Microsoft Excel
2 3 (17.65%) MS Visio
Business Applications
1 2 (11.76%) Dynamics CRM
Cloud Services
1 12 (70.59%) Power Platform
2 9 (52.94%) Azure
3 7 (41.18%) Power Automate
4 5 (29.41%) Azure DevOps
4 5 (29.41%) PowerApps
5 2 (11.76%) Zapier
6 1 (5.88%) WhatsApp
Communications & Networking
1 1 (5.88%) FTP
Database & Business Intelligence
1 12 (70.59%) Power BI
2 7 (41.18%) SQL Server
2 7 (41.18%) Tableau
3 4 (23.53%) Data Warehouse
4 2 (11.76%) Azure SQL Database
4 2 (11.76%) Qlik Sense
4 2 (11.76%) SQL Server Integration Services
4 2 (11.76%) SQL Server Reporting Services
5 1 (5.88%) Data Mart
Development Applications
1 3 (17.65%) JIRA
2 2 (11.76%) Git
2 2 (11.76%) Jenkins
2 2 (11.76%) JUnit
2 2 (11.76%) Mockito
2 2 (11.76%) Subversion
3 1 (5.88%) IBM UrbanCode
General
1 5 (29.41%) Analytical Skills
1 5 (29.41%) Retail
2 3 (17.65%) Finance
3 2 (11.76%) Social Skills
4 1 (5.88%) Front Office
4 1 (5.88%) Law
4 1 (5.88%) Organisational Skills
4 1 (5.88%) Public Sector
4 1 (5.88%) Publishing
Job Titles
1 9 (52.94%) Analyst
2 8 (47.06%) Developer
3 6 (35.29%) Senior
4 5 (29.41%) Business Analyst
4 5 (29.41%) Power Platform Developer
5 4 (23.53%) Senior Analyst
5 4 (23.53%) Senior Business Analyst
6 2 (11.76%) Business Systems Analyst
6 2 (11.76%) Data Analyst
6 2 (11.76%) Java Developer
6 2 (11.76%) Lead
6 2 (11.76%) Lead Data Analyst
6 2 (11.76%) Senior Developer
6 2 (11.76%) Senior Java Developer
6 2 (11.76%) Systems Analyst
7 1 (5.88%) Murex Developer
Libraries, Frameworks & Software Standards
1 3 (17.65%) Kafka
2 2 (11.76%) .NET
2 2 (11.76%) AngularJS
2 2 (11.76%) JSON
2 2 (11.76%) React
2 2 (11.76%) REST
2 2 (11.76%) SOAP
2 2 (11.76%) Spring
2 2 (11.76%) Spring Boot
2 2 (11.76%) XML
3 1 (5.88%) Murex MxML
Miscellaneous
1 5 (29.41%) Data Structures
2 3 (17.65%) Management Information System
3 2 (11.76%) Greenfield Project
3 2 (11.76%) Self-Motivation
4 1 (5.88%) Foreign Exchange (FX)
4 1 (5.88%) Public Cloud
Operating Systems
1 1 (5.88%) Linux
1 1 (5.88%) Red Hat Enterprise Linux
1 1 (5.88%) Unix
Processes & Methodologies
1 12 (70.59%) Business Intelligence
1 12 (70.59%) Workflow
2 8 (47.06%) DevOps
3 5 (29.41%) Contingency Planning
3 5 (29.41%) Dashboard Development
3 5 (29.41%) Data Entry
3 5 (29.41%) Data Protection
3 5 (29.41%) Data Visualisation
3 5 (29.41%) Disaster Recovery
3 5 (29.41%) Requirements Gathering
3 5 (29.41%) Visualisation
4 4 (23.53%) Business Analysis
4 4 (23.53%) Project Management
4 4 (23.53%) Requirements Workshops
4 4 (23.53%) Use Case
5 3 (17.65%) BPMN
5 3 (17.65%) CRM
5 3 (17.65%) Customer Service
5 3 (17.65%) Mathematics
5 3 (17.65%) Stakeholder Management
Programming Languages
1 13 (76.47%) SQL
2 5 (29.41%) Data Analysis Expressions
2 5 (29.41%) Python
3 3 (17.65%) Java
4 2 (11.76%) C#
4 2 (11.76%) Julia
4 2 (11.76%) PowerShell
4 2 (11.76%) R
4 2 (11.76%) T-SQL
4 2 (11.76%) VB.NET
5 1 (5.88%) Perl
Qualifications
1 3 (17.65%) DBS Check
2 1 (5.88%) Degree
Quality Assurance & Compliance
1 1 (5.88%) PMO
System Software
1 2 (11.76%) Docker
1 2 (11.76%) Virtual Machines
1 2 (11.76%) vSphere
Systems Management
1 2 (11.76%) Kubernetes
Vendors
1 5 (29.41%) Microsoft
2 2 (11.76%) Salesforce
3 1 (5.88%) Murex
3 1 (5.88%) Oracle