Hybrid/Remote Data Analytics Job Trends

Data Analytics
UK > Work from Home

The table below provides summary statistics and salary benchmarking for remote or hybrid work requiring Data Analytics skills. It covers permanent job vacancies from the 6 months leading up to 15 November 2025, with comparisons to the same periods in the previous two years.

6 months to
15 Nov 2025
Same period 2024 Same period 2023
Rank 197 216 165
Rank change year-on-year +19 -51 +40
Permanent jobs citing Data Analytics 207 290 453
As % of all permanent jobs with remote/hybrid work options 1.32% 1.46% 2.07%
As % of the Processes & Methodologies category 1.44% 1.65% 2.18%
Number of salaries quoted 125 154 359
10th Percentile £43,650 £42,875 £46,250
25th Percentile £57,500 £54,439 £55,000
Median annual salary (50th Percentile) £70,000 £65,400 £70,000
Median % change year-on-year +7.03% -6.57% +2.21%
75th Percentile £92,500 £82,500 £87,500
90th Percentile £130,000 £102,974 £108,750
UK median annual salary £60,000 £65,000 £65,000
% change year-on-year -7.69% - -6.23%

All Process and Methodology Skills
Work from Home

Data Analytics falls under the Processes and Methodologies category. For comparison with the information above, the following table provides summary statistics for all permanent job vacancies with remote or hybrid options requiring process or methodology skills.

Permanent vacancies with a requirement for process or methodology skills 14,377 17,627 20,780
As % of all permanent jobs with a WFH option 91.87% 88.62% 94.99%
Number of salaries quoted 8,785 10,527 16,788
10th Percentile £29,500 £36,250 £36,750
25th Percentile £40,000 £46,250 £46,521
Median annual salary (50th Percentile) £57,500 £62,500 £62,500
Median % change year-on-year -8.00% - -
75th Percentile £77,500 £81,250 £80,406
90th Percentile £98,750 £100,000 £97,500
UK median annual salary £55,000 £60,000 £60,000
% change year-on-year -8.33% - -

Data Analytics
Job Vacancy Trend for Remote/Hybrid Jobs

Historical trend showing the proportion of permanent IT job postings citing Data Analytics and offering remote or hybrid work options relative to all permanent IT jobs advertised.
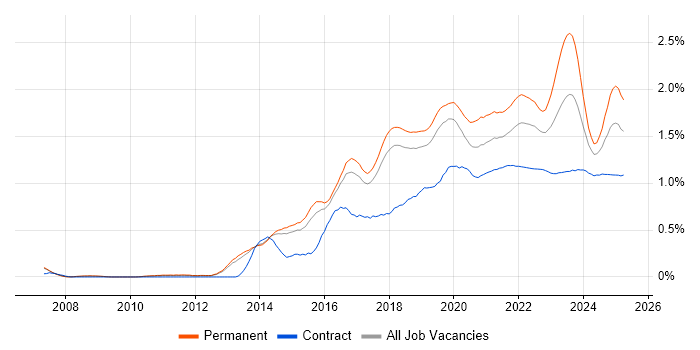
Data Analytics job vacancy trend for remote/hybrid jobs

Data Analytics
Salary Trend for Remote/Hybrid Jobs

Salary distribution trend for jobs with remote/hybrid work options citing Data Analytics.

Salary distribution trend for jobs with remote/hybrid work options citing Data Analytics

Data Analytics
Salary Histogram for Remote/Hybrid Jobs

Salary distribution for jobs with remote/hybrid work options citing Data Analytics over the 6 months to 15 November 2025.

Data Analytics salary histogram for jobs with remote/hybrid work options

Data Analytics
Co-Occurring Skills & Capabilities in Remote/Hybrid Jobs by Category

The following tables expand on the one above by listing co-occurrences grouped by category. They cover the same employment type, locality and period, with up to 20 co-occurrences shown in each category:

Application Platforms
1 9 (4.35%) SAS
2 4 (1.93%) Apache Airflow
2 4 (1.93%) Apache Spark
3 3 (1.45%) Apache
3 3 (1.45%) SharePoint
4 2 (0.97%) CMS
4 2 (0.97%) Confluence
5 1 (0.48%) Jupyter
Applications
1 38 (18.36%) Microsoft Excel
2 12 (5.80%) Microsoft Office
3 5 (2.42%) Microsoft Project
4 2 (0.97%) Spreadsheet
5 1 (0.48%) Microsoft PowerPoint
5 1 (0.48%) Notion
Business Applications
1 5 (2.42%) NetSuite
2 4 (1.93%) Salesforce CRM
3 2 (0.97%) Oracle Assets
3 2 (0.97%) Oracle General Ledger
3 2 (0.97%) Oracle Payables
3 2 (0.97%) Oracle Receivables
4 1 (0.48%) Integrated Workplace Management System
4 1 (0.48%) Primavera
4 1 (0.48%) Sparx Enterprise Architect
Cloud Services
1 70 (33.82%) Power Platform
2 50 (24.15%) Azure
3 22 (10.63%) SaaS
4 21 (10.14%) AWS
5 17 (8.21%) Azure Data Factory
6 14 (6.76%) Snowflake
7 12 (5.80%) Azure Synapse Analytics
7 12 (5.80%) GCP
8 8 (3.86%) AWS Lambda
8 8 (3.86%) Serverless
9 7 (3.38%) dbt
10 6 (2.90%) Amazon S3
10 6 (2.90%) Collibra
11 5 (2.42%) AWS CloudFormation
11 5 (2.42%) Microsoft 365
11 5 (2.42%) PaaS
11 5 (2.42%) Power Automate
12 4 (1.93%) Amazon Kinesis
12 4 (1.93%) AWS Step Functions
12 4 (1.93%) Fivetran
Communications & Networking
1 4 (1.93%) Broadband
1 4 (1.93%) CHAP
2 1 (0.48%) Ethernet
2 1 (0.48%) FTP
2 1 (0.48%) Modbus
Database & Business Intelligence
1 68 (32.85%) Power BI
2 31 (14.98%) Tableau
3 21 (10.14%) Data Warehouse
4 15 (7.25%) SQL Server Reporting Services
5 14 (6.76%) SQL Server
6 13 (6.28%) Azure SQL Database
7 10 (4.83%) Looker
8 8 (3.86%) Amazon Redshift
8 8 (3.86%) Data Lake
8 8 (3.86%) Power Query
9 6 (2.90%) Big Data
9 6 (2.90%) Metadata
10 5 (2.42%) Amazon Athena
11 4 (1.93%) BigQuery
11 4 (1.93%) SQL Server Integration Services
12 3 (1.45%) Amazon RDS
12 3 (1.45%) Qlik Sense
13 2 (0.97%) DynamoDB
13 2 (0.97%) MongoDB
13 2 (0.97%) QlikView
Development Applications
1 5 (2.42%) ER Studio
2 3 (1.45%) Git
3 2 (0.97%) JIRA
4 1 (0.48%) Jenkins
4 1 (0.48%) RStudio
4 1 (0.48%) Subversion
4 1 (0.48%) TeamCity
General
1 101 (48.79%) Social Skills
2 83 (40.10%) Finance
3 63 (30.43%) Analytical Skills
4 30 (14.49%) Banking
5 20 (9.66%) Legal
6 19 (9.18%) Law
6 19 (9.18%) Manufacturing
7 18 (8.70%) Inclusion and Diversity
7 18 (8.70%) Retail
8 15 (7.25%) Financial Institution
8 15 (7.25%) Marketing
9 13 (6.28%) Billing
10 10 (4.83%) Influencing Skills
11 9 (4.35%) Public Sector
12 7 (3.38%) Organisational Skills
12 7 (3.38%) Presentation Skills
13 6 (2.90%) Front Office
14 5 (2.42%) Investment Banking
15 4 (1.93%) Pharmaceutical
16 3 (1.45%) Electronics
Job Titles
1 47 (22.71%) Analyst
2 30 (14.49%) Senior
3 18 (8.70%) Data Engineer
4 16 (7.73%) Architect
4 16 (7.73%) Audit Manager
4 16 (7.73%) Data Analyst
5 15 (7.25%) Auditor
5 15 (7.25%) Insight Analyst
5 15 (7.25%) Internal Auditor
6 14 (6.76%) Developer
7 13 (6.28%) Commercial Analyst
8 11 (5.31%) Data Manager
8 11 (5.31%) IT Manager
9 10 (4.83%) Analytics Manager
9 10 (4.83%) IT Audit Manager
9 10 (4.83%) Senior Manager
10 9 (4.35%) Consultant
11 8 (3.86%) Business Intelligence Analyst
11 8 (3.86%) Data Consultant
12 7 (3.38%) Senior Service Manager
Libraries, Frameworks & Software Standards
1 7 (3.38%) Middleware
2 5 (2.42%) PyXLL
3 4 (1.93%) Kafka
4 3 (1.45%) AngularJS
4 3 (1.45%) RabbitMQ
4 3 (1.45%) React
5 2 (0.97%) CSS
5 2 (0.97%) EDI
5 2 (0.97%) HTML
5 2 (0.97%) Hugging Face
5 2 (0.97%) Node.js
5 2 (0.97%) Nuxt
5 2 (0.97%) Oracle Fusion
5 2 (0.97%) PySpark
5 2 (0.97%) REST
5 2 (0.97%) Vue
6 1 (0.48%) FastAPI
6 1 (0.48%) JSON
6 1 (0.48%) Plotly
6 1 (0.48%) XML
Miscellaneous
1 20 (9.66%) Self-Motivation
2 15 (7.25%) Management Information System
3 12 (5.80%) Analytical Mindset
4 8 (3.86%) Algorithms
4 8 (3.86%) Augmented Reality
5 7 (3.38%) IoT
6 6 (2.90%) Onboarding
7 5 (2.42%) Cloud Native
7 5 (2.42%) Legacy Systems
7 5 (2.42%) Robotics
8 3 (1.45%) Educational Technology
8 3 (1.45%) Virtual Reality
9 2 (0.97%) Blockchain
9 2 (0.97%) Cyber Threat
9 2 (0.97%) Data Structures
9 2 (0.97%) Distributed Computing
9 2 (0.97%) Distributed Systems
9 2 (0.97%) Enterprise Software
9 2 (0.97%) Foreign Exchange (FX)
9 2 (0.97%) Smart Home
Operating Systems
1 8 (3.86%) Linux
2 7 (3.38%) Unix
2 7 (3.38%) Windows
Processes & Methodologies
1 207 (100.00%) Analytics
2 78 (37.68%) Business Intelligence
3 65 (31.40%) Decision-Making
4 57 (27.54%) Problem-Solving
5 53 (25.60%) AI
6 51 (24.64%) Agile
7 42 (20.29%) Data Analysis
8 40 (19.32%) Visualisation
9 34 (16.43%) Risk Management
10 33 (15.94%) Actionable Insight
11 32 (15.46%) Data Management
11 32 (15.46%) DevOps
12 31 (14.98%) Data Governance
13 29 (14.01%) Data Modelling
14 27 (13.04%) Data-Driven Decision Making
15 26 (12.56%) Roadmaps
16 25 (12.08%) ETL
17 24 (11.59%) Data Visualisation
18 23 (11.11%) Machine Learning
18 23 (11.11%) Project Management
Programming Languages
1 78 (37.68%) SQL
2 66 (31.88%) Python
3 20 (9.66%) R
4 19 (9.18%) Data Analysis Expressions
5 11 (5.31%) C++
6 7 (3.38%) Java
7 6 (2.90%) C#
8 4 (1.93%) Fortran
8 4 (1.93%) PL/SQL
9 3 (1.45%) Bash
9 3 (1.45%) C
9 3 (1.45%) Google Apps Script
9 3 (1.45%) MATLAB
9 3 (1.45%) PowerShell
9 3 (1.45%) Scala
9 3 (1.45%) Tcl
10 2 (0.97%) JavaScript
11 1 (0.48%) PHP
11 1 (0.48%) T-SQL
11 1 (0.48%) VBA
Qualifications
1 62 (29.95%) Degree
2 15 (7.25%) CISA
3 14 (6.76%) Master's Degree
4 13 (6.28%) ACCA
4 13 (6.28%) Security Cleared
5 12 (5.80%) CISSP
6 11 (5.31%) SC Cleared
7 7 (3.38%) AWS Certification
7 7 (3.38%) CIMA
8 6 (2.90%) BPSS Clearance
9 4 (1.93%) CGEIT
9 4 (1.93%) CISM
9 4 (1.93%) FFIEC
9 4 (1.93%) Microsoft Certification
9 4 (1.93%) SANS
10 3 (1.45%) Computer Science Degree
10 3 (1.45%) PhD
11 2 (0.97%) AWS Certified Developer
11 2 (0.97%) DBS Check
11 2 (0.97%) SnowPro
Quality Assurance & Compliance
1 34 (16.43%) Data Quality
2 14 (6.76%) GDPR
3 12 (5.80%) ISO/IEC 27001
4 11 (5.31%) IFRS
5 8 (3.86%) Sarbanes-Oxley
6 5 (2.42%) Accessibility
6 5 (2.42%) NIST
7 4 (1.93%) COBIT
7 4 (1.93%) PMO
8 3 (1.45%) SOC 2
9 2 (0.97%) HIPAA
9 2 (0.97%) PCI DSS
10 1 (0.48%) Actionable Recommendations
10 1 (0.48%) GRC
10 1 (0.48%) MiFID
10 1 (0.48%) NCSC
10 1 (0.48%) NIST 800
10 1 (0.48%) WCAG
System Software
1 4 (1.93%) Docker
2 2 (0.97%) Firmware
3 1 (0.48%) Slurm Workload Manager
Systems Management
1 6 (2.90%) Kubernetes
1 6 (2.90%) Terraform
2 1 (0.48%) Ganglia
2 1 (0.48%) Nessus
2 1 (0.48%) RSA Archer
2 1 (0.48%) Single Sign-On
Vendors
1 41 (19.81%) Microsoft
2 19 (9.18%) Google
3 14 (6.76%) Databricks
4 11 (5.31%) Oracle
4 11 (5.31%) Salesforce
5 9 (4.35%) SAP
6 7 (3.38%) Alteryx
7 3 (1.45%) Informatica
7 3 (1.45%) Talend
7 3 (1.45%) Teradata
8 2 (0.97%) Cloudera
8 2 (0.97%) IBM
8 2 (0.97%) OpenAI
8 2 (0.97%) ServiceNow
9 1 (0.48%) BiZZdesign
9 1 (0.48%) dotdigital
9 1 (0.48%) Planon
9 1 (0.48%) Sparx
9 1 (0.48%) Spotify
9 1 (0.48%) TikTok