Hybrid/Remote Power BI Job Trends

Microsoft Power BI
UK > Work from Home

The table below provides summary statistics and salary benchmarking for remote or hybrid work requiring Power BI skills. It covers permanent job vacancies from the 6 months leading up to 8 November 2025, with comparisons to the same periods in the previous two years.

6 months to
8 Nov 2025
Same period 2024 Same period 2023
Rank 68 76 58
Rank change year-on-year +8 -18 +28
Permanent jobs citing Power BI 668 710 1,108
As % of all permanent jobs with remote/hybrid work options 4.18% 3.57% 5.02%
As % of the Database & Business Intelligence category 28.15% 15.61% 20.05%
Number of salaries quoted 472 452 924
10th Percentile £36,350 £39,250 £36,825
25th Percentile £41,250 £46,250 £45,940
Median annual salary (50th Percentile) £55,000 £65,000 £55,148
Median % change year-on-year -15.38% +17.87% +0.27%
75th Percentile £69,880 £80,000 £72,450
90th Percentile £89,875 £93,750 £85,000
UK median annual salary £55,000 £60,000 £55,000
% change year-on-year -8.33% +9.09% -

All Database and Business Intelligence Skills
Work from Home

Power BI falls under the Databases and Business Intelligence category. For comparison with the information above, the following table provides summary statistics for all permanent job vacancies with remote or hybrid options requiring database or business intelligence skills.

Permanent vacancies with a requirement for database or business intelligence skills 2,373 4,547 5,525
As % of all permanent jobs with a WFH option 14.86% 22.89% 25.01%
Number of salaries quoted 1,775 2,743 4,426
10th Percentile £35,500 £39,325 £39,294
25th Percentile £45,000 £48,750 £47,500
Median annual salary (50th Percentile) £60,000 £70,000 £60,000
Median % change year-on-year -14.29% +16.67% -
75th Percentile £81,500 £95,000 £77,715
90th Percentile £110,000 £122,500 £94,750
UK median annual salary £60,000 £65,000 £60,000
% change year-on-year -7.69% +8.33% -2.83%

Power BI
Job Vacancy Trend for Remote/Hybrid Jobs

Historical trend showing the proportion of permanent IT job postings citing Power BI and offering remote or hybrid work options relative to all permanent IT jobs advertised.
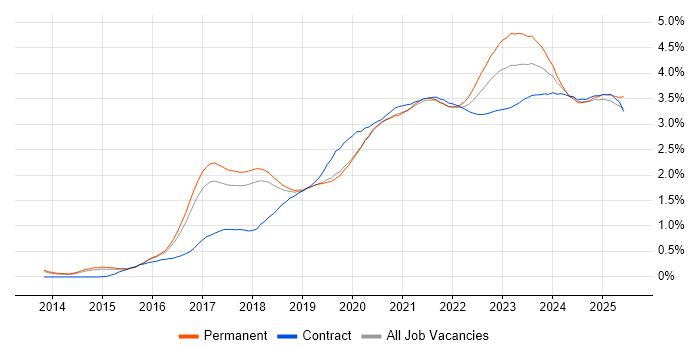
Power BI job vacancy trend for remote/hybrid jobs

Power BI
Salary Trend for Remote/Hybrid Jobs

Salary distribution trend for jobs with remote/hybrid work options citing Power BI.

Salary distribution trend for jobs with remote/hybrid work options citing Power BI

Power BI
Salary Histogram for Remote/Hybrid Jobs

Salary distribution for jobs with remote/hybrid work options citing Power BI over the 6 months to 8 November 2025.

Power BI salary histogram for jobs with remote/hybrid work options

Power BI
Co-Occurring Skills & Capabilities in Remote/Hybrid Jobs by Category

The following tables expand on the one above by listing co-occurrences grouped by category. They cover the same employment type, locality and period, with up to 20 co-occurrences shown in each category:

Application Platforms
1 57 (8.53%) SharePoint
2 16 (2.40%) Confluence
3 14 (2.10%) Microsoft Exchange
4 10 (1.50%) Oracle SOA Suite
5 7 (1.05%) SAS
6 5 (0.75%) Apache Airflow
6 5 (0.75%) Moodle
7 3 (0.45%) ArcGIS
7 3 (0.45%) Jupyter
8 2 (0.30%) CMS
9 1 (0.15%) Apache
9 1 (0.15%) Apache Spark
9 1 (0.15%) HCL Notes
Applications
1 249 (37.28%) Microsoft Excel
2 35 (5.24%) Microsoft Office
3 24 (3.59%) Microsoft PowerPoint
4 10 (1.50%) Spreadsheet
5 7 (1.05%) Trello
6 6 (0.90%) MS Visio
7 4 (0.60%) Microsoft Project
8 3 (0.45%) AutoCAD
8 3 (0.45%) Blender
8 3 (0.45%) Civil 3D
8 3 (0.45%) Navisworks
8 3 (0.45%) ProjectWise
8 3 (0.45%) Revit
Business Applications
1 31 (4.64%) Dynamics CRM
2 11 (1.65%) Oracle ERP
3 8 (1.20%) NetSuite
3 8 (1.20%) Visualfiles
4 7 (1.05%) Dynamics GP
5 4 (0.60%) Sage 1000
5 4 (0.60%) SAP FI
6 3 (0.45%) ResourceLink
7 2 (0.30%) Dynamics NAV
7 2 (0.30%) Elite 3E
7 2 (0.30%) FastStats
7 2 (0.30%) Primavera
7 2 (0.30%) Raiser’s Edge
7 2 (0.30%) Sage 200
8 1 (0.15%) Dynamics AX
8 1 (0.15%) FastStats PeopleStage
8 1 (0.15%) Pegasus Opera
8 1 (0.15%) Salesforce CRM
8 1 (0.15%) SAP S/4HANA
8 1 (0.15%) Shopify
Cloud Services
1 668 (100.00%) Power Platform
2 276 (41.32%) Azure
3 95 (14.22%) Power Automate
4 85 (12.72%) PowerApps
5 76 (11.38%) Azure Data Factory
6 74 (11.08%) Microsoft 365
7 61 (9.13%) Azure DevOps
8 50 (7.49%) Azure Synapse Analytics
8 50 (7.49%) Dynamics 365
9 49 (7.34%) AWS
10 47 (7.04%) SaaS
11 43 (6.44%) Snowflake
12 32 (4.79%) GitHub
13 31 (4.64%) GCP
14 26 (3.89%) Entra ID
15 25 (3.74%) Microsoft Purview
16 19 (2.84%) Azure AI
16 19 (2.84%) Microsoft Copilot
16 19 (2.84%) PaaS
17 18 (2.69%) Azure Service Bus
Communications & Networking
1 20 (2.99%) Firewall
2 17 (2.54%) DNS
2 17 (2.54%) WAN
3 15 (2.25%) SD-WAN
3 15 (2.25%) VPN
4 2 (0.30%) DHCP
4 2 (0.30%) LAN
4 2 (0.30%) NAS
4 2 (0.30%) SAN
4 2 (0.30%) Wi-Fi
5 1 (0.15%) ADSL
5 1 (0.15%) Broadband
5 1 (0.15%) Ethernet
5 1 (0.15%) Internet
5 1 (0.15%) Modbus
Database & Business Intelligence
1 134 (20.06%) Tableau
2 98 (14.67%) SQL Server
3 84 (12.57%) Data Warehouse
4 71 (10.63%) SQL Server Reporting Services
5 54 (8.08%) Data Lake
6 45 (6.74%) Power Query
7 42 (6.29%) Azure SQL Database
8 40 (5.99%) SQL Server Integration Services
9 22 (3.29%) Metadata
10 21 (3.14%) BusinessObjects
10 21 (3.14%) Crystal Reports
11 19 (2.84%) MySQL
12 17 (2.54%) Looker
13 16 (2.40%) SQL Server Analysis Services
14 14 (2.10%) BigQuery
15 13 (1.95%) Azure SQL Data Warehouse
15 13 (1.95%) Data Mining
16 12 (1.80%) Relational Database
17 8 (1.20%) Data Vault
17 8 (1.20%) Oracle Database
Development Applications
1 37 (5.54%) Git
2 32 (4.79%) JIRA
3 11 (1.65%) Jenkins
3 11 (1.65%) Oracle Forms
4 6 (0.90%) ERwin
5 4 (0.60%) ER Studio
5 4 (0.60%) PowerDesigner
5 4 (0.60%) RStudio
6 3 (0.45%) SQL Server Management Studio (SSMS)
6 3 (0.45%) Visual Studio
6 3 (0.45%) Visual Studio Code
7 1 (0.15%) Cypress.io
7 1 (0.15%) MLflow
7 1 (0.15%) PHPUnit
7 1 (0.15%) Postman
7 1 (0.15%) Subversion
7 1 (0.15%) Vite
General
1 292 (43.71%) Finance
2 243 (36.38%) Social Skills
3 222 (33.23%) Analytical Skills
4 65 (9.73%) Marketing
5 61 (9.13%) Retail
6 51 (7.63%) Inclusion and Diversity
7 42 (6.29%) Manufacturing
8 36 (5.39%) Public Sector
9 29 (4.34%) Presentation Skills
10 28 (4.19%) Law
11 25 (3.74%) Organisational Skills
12 22 (3.29%) Legal
13 18 (2.69%) Billing
14 11 (1.65%) Advertising
14 11 (1.65%) Banking
14 11 (1.65%) Local Government
15 10 (1.50%) Pharmaceutical
16 9 (1.35%) Games
16 9 (1.35%) Social Housing
16 9 (1.35%) Telecoms
Job Titles
1 252 (37.72%) Analyst
2 122 (18.26%) Developer
3 86 (12.87%) Senior
4 76 (11.38%) Data Analyst
5 54 (8.08%) Business Intelligence Analyst
6 53 (7.93%) Lead
7 47 (7.04%) Business Intelligence Developer
8 42 (6.29%) Data Engineer
9 41 (6.14%) Business Analyst
10 30 (4.49%) Power BI Analyst
11 29 (4.34%) Architect
12 27 (4.04%) Financial Analyst
12 27 (4.04%) Power Platform Developer
13 26 (3.89%) Insight Analyst
14 25 (3.74%) Support Analyst
15 23 (3.44%) Power BI Developer
16 22 (3.29%) Senior Analyst
16 22 (3.29%) Senior Developer
17 20 (2.99%) Accountant
17 20 (2.99%) Systems Accountant
Libraries, Frameworks & Software Standards
1 23 (3.44%) .NET
2 17 (2.54%) HTML5 Canvas
3 11 (1.65%) OAuth
3 11 (1.65%) OAuth2
4 10 (1.50%) JSON
4 10 (1.50%) Middleware
4 10 (1.50%) Pandas
4 10 (1.50%) RESTful
4 10 (1.50%) SAML
5 8 (1.20%) XML
6 7 (1.05%) .NET Core
6 7 (1.05%) HTML
6 7 (1.05%) REST
6 7 (1.05%) scikit-learn
7 6 (0.90%) CSS
7 6 (0.90%) NumPy
7 6 (0.90%) Web Services
8 5 (0.75%) ASP.NET
8 5 (0.75%) EDI
9 4 (0.60%) PySpark
Miscellaneous
1 46 (6.89%) Analytical Mindset
2 43 (6.44%) Management Information System
3 41 (6.14%) Self-Motivation
4 27 (4.04%) Cloud Native
5 23 (3.44%) Onboarding
6 22 (3.29%) Product Ownership
7 20 (2.99%) NHS
8 18 (2.69%) Data Structures
9 17 (2.54%) Legacy Systems
10 15 (2.25%) Data Centre
10 15 (2.25%) Enterprise Software
11 8 (1.20%) Learning Management System
11 8 (1.20%) Low-Code
12 7 (1.05%) Driving Licence
12 7 (1.05%) Reinsurance
12 7 (1.05%) Social Media
13 5 (0.75%) Foreign Exchange (FX)
14 4 (0.60%) IoT
14 4 (0.60%) Private Cloud
15 3 (0.45%) Greenfield Project
Operating Systems
1 31 (4.64%) Windows
2 7 (1.05%) Linux
2 7 (1.05%) Unix
3 5 (0.75%) Windows Server
4 2 (0.30%) Windows Server 2012
Processes & Methodologies
1 591 (88.47%) Business Intelligence
2 253 (37.87%) Analytics
3 188 (28.14%) Decision-Making
4 187 (27.99%) Visualisation
5 165 (24.70%) Problem-Solving
6 149 (22.31%) Continuous Improvement
7 138 (20.66%) Agile
8 133 (19.91%) Data Analysis
9 123 (18.41%) AI
10 117 (17.51%) Data Visualisation
11 101 (15.12%) Data Modelling
12 99 (14.82%) Actionable Insight
13 86 (12.87%) DevOps
14 85 (12.72%) CRM
15 82 (12.28%) ETL
16 76 (11.38%) Process Improvement
17 75 (11.23%) Data Management
18 74 (11.08%) Data Governance
19 73 (10.93%) Stakeholder Engagement
20 69 (10.33%) Coaching
Programming Languages
1 426 (63.77%) SQL
2 162 (24.25%) Python
3 74 (11.08%) Data Analysis Expressions
4 40 (5.99%) C#
5 33 (4.94%) JavaScript
6 32 (4.79%) R
7 28 (4.19%) VBA
8 25 (3.74%) PowerShell
9 22 (3.29%) T-SQL
10 17 (2.54%) Java
11 15 (2.25%) Bicep
12 13 (1.95%) Scala
13 11 (1.65%) PL/SQL
14 10 (1.50%) Shell Script
15 5 (0.75%) TypeScript
16 4 (0.60%) VB.NET
17 3 (0.45%) Bash
18 1 (0.15%) Julia
18 1 (0.15%) PHP
Qualifications
1 110 (16.47%) Degree
2 44 (6.59%) ACCA
2 44 (6.59%) CIMA
3 36 (5.39%) DBS Check
3 36 (5.39%) Microsoft Certification
4 34 (5.09%) Computer Science Degree
5 33 (4.94%) Security Cleared
6 31 (4.64%) SC Cleared
7 29 (4.34%) Azure Certification
8 16 (2.40%) Master's Degree
9 13 (1.95%) CISSP
9 13 (1.95%) Numerate Degree
9 13 (1.95%) Six Sigma Green Belt
10 12 (1.80%) CISA
11 5 (0.75%) CISM
11 5 (0.75%) CRISC
11 5 (0.75%) DV Cleared
12 3 (0.45%) BPSS Clearance
12 3 (0.45%) PhD
13 2 (0.30%) AWS Certification
Quality Assurance & Compliance
1 72 (10.78%) Data Quality
2 28 (4.19%) GDPR
3 25 (3.74%) Accessibility
4 17 (2.54%) ISO/IEC 27001
5 15 (2.25%) Actionable Recommendations
6 13 (1.95%) PMO
7 12 (1.80%) QA
8 10 (1.50%) SLA
9 5 (0.75%) COBIT
9 5 (0.75%) GRC
9 5 (0.75%) ITGC
9 5 (0.75%) NIST
10 2 (0.30%) ISO 22301
10 2 (0.30%) P3O
11 1 (0.15%) PCI DSS
System Software
1 15 (2.25%) Virtual Machines
2 6 (0.90%) VMware Infrastructure
3 5 (0.75%) Active Directory
4 2 (0.30%) Docker
4 2 (0.30%) VMware ESXi
4 2 (0.30%) vSphere
5 1 (0.15%) Hyper-V
5 1 (0.15%) Virtual Desktop
Systems Management
1 28 (4.19%) Single Sign-On
2 20 (2.99%) Terraform
3 8 (1.20%) Microsoft Intune
4 4 (0.60%) Failover Clustering
5 2 (0.30%) Kubernetes
6 1 (0.15%) SCCM
Vendors
1 266 (39.82%) Microsoft
2 61 (9.13%) Databricks
3 35 (5.24%) Google
4 31 (4.64%) Oracle
5 30 (4.49%) Salesforce
6 20 (2.99%) Alteryx
7 19 (2.84%) SAP
8 18 (2.69%) Sage
9 16 (2.40%) Meraki
10 10 (1.50%) Facebook
11 8 (1.20%) Cognos
11 8 (1.20%) Concur
11 8 (1.20%) HubSpot
11 8 (1.20%) Informatica
12 6 (0.90%) Anaplan
12 6 (0.90%) Talend
12 6 (0.90%) VMware
13 5 (0.75%) Cisco
13 5 (0.75%) IBM
13 5 (0.75%) OpenAI