Analyst Jobs with Work from Home Options

Analyst
UK > Work from Home

The median Analyst salary for remote or hybrid work is £45,249 per year, according to job vacancies posted during the 6 months leading to 26 July 2024.

The table below provides salary benchmarking and summary statistics, comparing them to the same period in the previous two years.

6 months to
26 Jul 2024
Same period 2023 Same period 2022
Rank 16 19 31
Rank change year-on-year +3 +12 +10
Permanent jobs requiring an Analyst 2,944 3,429 7,160
As % of all permanent jobs with a WFH option 10.54% 10.45% 9.12%
As % of the Job Titles category 10.95% 10.90% 9.40%
Number of salaries quoted 1,641 2,758 5,237
10th Percentile £28,500 £30,000 £28,500
25th Percentile £35,000 £35,000 £36,250
Median annual salary (50th Percentile) £45,249 £45,341 £47,500
Median % change year-on-year -0.20% -4.55% +5.56%
75th Percentile £62,500 £60,000 £61,250
90th Percentile £77,500 £72,500 £75,000
UK median annual salary £45,000 £45,000 £47,154
% change year-on-year - -4.57% +6.34%

All Permanent IT Job Vacancies
Work from Home

For comparison with the information above, the following table provides summary statistics for all permanent IT job vacancies with WFH or hybrid options. Most job vacancies include a discernible job title that can be normalized. As such, the figures in the second row provide an indication of the number of permanent jobs in our overall sample.

Permanent vacancies in Work from Home with a recognized job title 26,891 31,453 76,163
% of permanent jobs with a recognized job title 96.26% 95.84% 96.99%
Number of salaries quoted 19,582 23,849 44,441
10th Percentile £34,500 £36,750 £36,250
25th Percentile £42,500 £46,749 £45,750
Median annual salary (50th Percentile) £57,500 £62,500 £60,000
Median % change year-on-year -8.00% +4.17% +9.09%
75th Percentile £75,728 £80,000 £80,000
90th Percentile £95,000 £100,000 £95,000
UK median annual salary £55,000 £60,000 £60,000
% change year-on-year -8.33% - +9.09%

Analyst
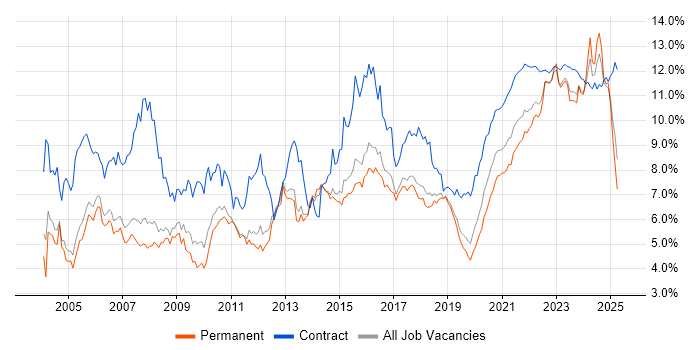
Trend for Jobs with a WFH Option

Job vacancies with a work from home option which featured Analyst in the job title as a proportion of all IT jobs advertised.

Analyst trend for jobs with a WFH option

Analyst
Salary Trend for Jobs with a WFH Option

3-month moving average salary quoted in job vacancies with a work from home option citing Analyst.

Analyst salary trend for jobs with a WFH option

Analyst
Salary Histogram for Jobs with a WFH Option

Salary distribution for jobs with a work from home option citing Analyst over the 6 months to 26 July 2024.

Analyst salary histogram for jobs with a WFH option

Analyst Skill Set
Top 30 Co-occurring Skills and Capabilities in Job Vacancies with WFH Options

For the 6 months to 26 July 2024, Analyst job roles required the following skills and capabilities in order of popularity. The figures indicate the absolute number co-occurrences and as a proportion of all permanent jobs with remote work options featuring Analyst in the job title.

1 1,326 (45.04%) Social Skills
2 1,147 (38.96%) Finance
3 1,077 (36.58%) Analytical Skills
4 949 (32.24%) Microsoft
5 923 (31.35%) Agile
6 739 (25.10%) Microsoft Excel
7 710 (24.12%) Actionable Insight
8 702 (23.85%) SQL
9 680 (23.10%) Decision-Making
10 574 (19.50%) Problem-Solving
11 564 (19.16%) Degree
12 525 (17.83%) Mentoring
13 497 (16.88%) ACCA
14 493 (16.75%) CIMA
15 483 (16.41%) Broadband
16 479 (16.27%) Business Case
17 477 (16.20%) Budgeting and Forecasting
18 476 (16.17%) Budgeting
19 473 (16.07%) Influencing Skills
20 422 (14.33%) Analytics
21 371 (12.60%) Retail
22 350 (11.89%) Data Analysis
23 339 (11.51%) Python
24 328 (11.14%) Visualisation
25 323 (10.97%) Legal
26 283 (9.61%) Business Intelligence
27 276 (9.38%) Windows
28 275 (9.34%) Azure
29 273 (9.27%) Business Analysis
30 267 (9.07%) AWS

Analyst Skill Set
Co-occurring Skills and Capabilities with WFH Options by Category

The follow tables expand on the table above by listing co-occurrences grouped by category. The same employment type, locality and period is covered with up to 20 co-occurrences shown in each of the following categories:

Application Platforms
1 65 (2.21%) SharePoint
2 43 (1.46%) Microsoft Exchange
3 29 (0.99%) Apache
4 16 (0.54%) SAS
5 15 (0.51%) Confluence
6 12 (0.41%) IIS
7 8 (0.27%) CMS
7 8 (0.27%) Tomcat
8 5 (0.17%) WebSphere
9 4 (0.14%) Apache Airflow
9 4 (0.14%) WordPress
10 3 (0.10%) GlassFish
10 3 (0.10%) JBoss
11 2 (0.068%) Apache Spark
11 2 (0.068%) Moodle
12 1 (0.034%) Jupyter
12 1 (0.034%) Luigi
12 1 (0.034%) SharePoint 2013
12 1 (0.034%) Skype for Business
12 1 (0.034%) TPMS
Applications
1 739 (25.10%) Microsoft Excel
2 154 (5.23%) Microsoft Office
3 54 (1.83%) Microsoft PowerPoint
4 34 (1.15%) MS Visio
5 15 (0.51%) Spreadsheet
6 8 (0.27%) Microsoft Project
7 3 (0.10%) SPSS
8 2 (0.068%) Stata
9 1 (0.034%) UserZoom
Business Applications
1 29 (0.99%) Dynamics CRM
2 15 (0.51%) iTrent
3 13 (0.44%) Maximo
4 12 (0.41%) Endur
5 11 (0.37%) Magento
6 10 (0.34%) Elite 3E
6 10 (0.34%) Infor SunSystems
6 10 (0.34%) SAP Business One
7 9 (0.31%) Oracle Financials
8 8 (0.27%) Dynamics NAV
8 8 (0.27%) NEC Housing
8 8 (0.27%) SAP S/4HANA
9 6 (0.20%) Oracle EBS
9 6 (0.20%) Oracle ERP
10 5 (0.17%) NetSuite
10 5 (0.17%) SAP WM
11 4 (0.14%) Eagle PACE
11 4 (0.14%) Markit EDM
11 4 (0.14%) Salesforce CRM
11 4 (0.14%) SAP ERP
Cloud Services
1 275 (9.34%) Azure
2 267 (9.07%) AWS
3 266 (9.04%) Power Platform
4 230 (7.81%) Microsoft 365
5 103 (3.50%) Entra ID
6 71 (2.41%) SaaS
7 63 (2.14%) Dynamics 365
8 33 (1.12%) Azure DevOps
9 25 (0.85%) dbt
9 25 (0.85%) GCP
10 20 (0.68%) PowerApps
11 16 (0.54%) Google Analytics
11 16 (0.54%) Microsoft Purview
12 14 (0.48%) WhatsApp
13 13 (0.44%) PaaS
13 13 (0.44%) Power Automate
14 12 (0.41%) Azure Data Factory
15 11 (0.37%) Azure Sentinel
16 9 (0.31%) IaaS
17 8 (0.27%) Adobe Analytics
Communications & Networking
1 483 (16.41%) Broadband
2 83 (2.82%) Firewall
3 58 (1.97%) WAN
4 49 (1.66%) LAN
5 43 (1.46%) DNS
6 33 (1.12%) Wi-Fi
7 27 (0.92%) Internet
8 23 (0.78%) WLAN
9 20 (0.68%) VoIP
10 19 (0.65%) DHCP
10 19 (0.65%) VPN
11 18 (0.61%) TCP/IP
12 17 (0.58%) Network Security
12 17 (0.58%) SD-WAN
13 16 (0.54%) Wireless
14 14 (0.48%) BGP
14 14 (0.48%) OSPF
15 13 (0.44%) Intrusion Detection
16 11 (0.37%) Remote Desktop
17 10 (0.34%) MPLS
Database & Business Intelligence
1 252 (8.56%) Tableau
2 247 (8.39%) Power BI
3 91 (3.09%) SQL Server
4 52 (1.77%) Data Warehouse
5 39 (1.32%) SQL Server Reporting Services
6 36 (1.22%) BigQuery
7 31 (1.05%) Data Lake
8 27 (0.92%) Big Data
9 25 (0.85%) Metadata
10 22 (0.75%) Apache Arrow
10 22 (0.75%) Dremio
11 19 (0.65%) SQL Server Integration Services
12 18 (0.61%) QlikView
13 14 (0.48%) BusinessObjects
13 14 (0.48%) Power Query
14 13 (0.44%) Relational Database
15 11 (0.37%) Azure SQL Database
15 11 (0.37%) MS Access
15 11 (0.37%) Qlik Sense
16 10 (0.34%) SQL Server Analysis Services
Development Applications
1 135 (4.59%) Git
2 93 (3.16%) JIRA
3 18 (0.61%) Selenium
4 12 (0.41%) SQL Server Management Studio (SSMS)
5 11 (0.37%) JMeter
6 10 (0.34%) Postman
7 8 (0.27%) Burp Suite
7 8 (0.27%) Metasploit
7 8 (0.27%) SpecFlow
8 7 (0.24%) Subversion
8 7 (0.24%) WebDriver
9 6 (0.20%) Visual Studio
10 5 (0.17%) TeamCity
11 4 (0.14%) Cucumber
11 4 (0.14%) Eclipse
11 4 (0.14%) Team Foundation Server
11 4 (0.14%) TestRail
12 2 (0.068%) Bitbucket
12 2 (0.068%) GitLab
12 2 (0.068%) Jenkins
General
1 1,326 (45.04%) Social Skills
2 1,147 (38.96%) Finance
3 1,077 (36.58%) Analytical Skills
4 473 (16.07%) Influencing Skills
5 371 (12.60%) Retail
6 323 (10.97%) Legal
7 198 (6.73%) Presentation Skills
8 179 (6.08%) Banking
9 165 (5.60%) Inclusion and Diversity
10 146 (4.96%) Law
11 85 (2.89%) Marketing
12 81 (2.75%) Public Sector
13 75 (2.55%) Front Office
14 55 (1.87%) Manufacturing
15 54 (1.83%) Organisational Skills
16 47 (1.60%) Pharmaceutical
17 30 (1.02%) Back Office
18 27 (0.92%) Investment Banking
19 26 (0.88%) Local Government
20 22 (0.75%) Police
Libraries, Frameworks & Software Standards
1 36 (1.22%) HTML
2 30 (1.02%) .NET
3 22 (0.75%) Oracle Fusion
4 18 (0.61%) REST
5 17 (0.58%) XML
6 12 (0.41%) EDI
7 11 (0.37%) CSS
7 11 (0.37%) Web Services
8 10 (0.34%) JSON
8 10 (0.34%) Lightning Web Components
9 8 (0.27%) FIX Protocol
10 6 (0.20%) RESTful
10 6 (0.20%) SOAP
11 5 (0.17%) .NET Framework
11 5 (0.17%) Gherkin
11 5 (0.17%) Laravel
11 5 (0.17%) Middleware
12 4 (0.14%) 802.1X
12 4 (0.14%) LDAP
12 4 (0.14%) React
Miscellaneous
1 132 (4.48%) Management Information System
2 114 (3.87%) Product Ownership
3 61 (2.07%) Onboarding
4 56 (1.90%) Foreign Exchange (FX)
5 54 (1.83%) Self-Motivation
6 52 (1.77%) Derivative
7 51 (1.73%) Fixed Income
7 51 (1.73%) Life Science
8 46 (1.56%) Hedge funds
9 45 (1.53%) Equities
10 38 (1.29%) Analytical Mindset
11 30 (1.02%) Algorithms
11 30 (1.02%) Driving Licence
12 29 (0.99%) Cyber Threat
13 25 (0.85%) NHS
13 25 (0.85%) Social Media
14 22 (0.75%) Cyberattack
15 16 (0.54%) Low-Code
16 15 (0.51%) Data Centre
16 15 (0.51%) Security Operations Centre
Operating Systems
1 276 (9.38%) Windows
2 106 (3.60%) Windows 10
3 78 (2.65%) Windows Server
4 53 (1.80%) Linux
5 35 (1.19%) Apple iOS
6 31 (1.05%) Android
7 22 (0.75%) Unix
8 19 (0.65%) Windows Server 2019
8 19 (0.65%) Windows Vista
9 18 (0.61%) Windows 7
10 13 (0.44%) Windows Server 2012
11 11 (0.37%) Windows 8
12 10 (0.34%) Mac OS
12 10 (0.34%) Windows Server 2016
13 8 (0.27%) Mac OS X
14 5 (0.17%) Windows Server 2008
15 3 (0.10%) AIX
15 3 (0.10%) Red Hat Enterprise Linux
15 3 (0.10%) Solaris
16 1 (0.034%) HPUX
Processes & Methodologies
1 923 (31.35%) Agile
2 710 (24.12%) Actionable Insight
3 680 (23.10%) Decision-Making
4 574 (19.50%) Problem-Solving
5 525 (17.83%) Mentoring
6 479 (16.27%) Business Case
7 477 (16.20%) Budgeting and Forecasting
8 476 (16.17%) Budgeting
9 422 (14.33%) Analytics
10 350 (11.89%) Data Analysis
11 328 (11.14%) Visualisation
12 283 (9.61%) Business Intelligence
13 273 (9.27%) Business Analysis
14 249 (8.46%) ITIL
15 215 (7.30%) Statistics
16 209 (7.10%) Mathematics
17 205 (6.96%) Process Improvement
18 203 (6.90%) Requirements Gathering
19 193 (6.56%) Stakeholder Management
20 192 (6.52%) Customer Service
Programming Languages
1 702 (23.85%) SQL
2 339 (11.51%) Python
3 99 (3.36%) PowerShell
4 48 (1.63%) R
5 46 (1.56%) C#
6 39 (1.32%) T-SQL
7 33 (1.12%) JavaScript
8 24 (0.82%) Java
9 22 (0.75%) VBA
10 12 (0.41%) RPG
11 10 (0.34%) C++
12 8 (0.27%) Data Analysis Expressions
12 8 (0.27%) Julia
13 7 (0.24%) Bash
13 7 (0.24%) Kusto Query Language
13 7 (0.24%) TypeScript
14 6 (0.20%) PL/SQL
15 5 (0.17%) PHP
15 5 (0.17%) VB.NET
16 4 (0.14%) VB
Qualifications
1 564 (19.16%) Degree
2 497 (16.88%) ACCA
3 493 (16.75%) CIMA
4 161 (5.47%) DBS Check
5 139 (4.72%) Security Cleared
6 108 (3.67%) SC Cleared
7 49 (1.66%) Master's Degree
8 45 (1.53%) CISSP
9 34 (1.15%) CISM
10 33 (1.12%) PhD
11 31 (1.05%) Computer Science Degree
12 26 (0.88%) DV Cleared
12 26 (0.88%) Microsoft Certification
13 23 (0.78%) ISTQB
14 22 (0.75%) CISA
15 16 (0.54%) CompTIA Security+
16 14 (0.48%) Cisco Certification
17 13 (0.44%) A+ Certification
17 13 (0.44%) ITIL Certification
17 13 (0.44%) MCP
Quality Assurance & Compliance
1 129 (4.38%) QA
2 97 (3.29%) Data Quality
3 95 (3.23%) ISO/IEC 27001
4 47 (1.60%) NIST
5 44 (1.49%) SLA
6 38 (1.29%) GRC
7 35 (1.19%) Cyber Essentials
8 32 (1.09%) GDPR
9 26 (0.88%) PCI DSS
10 21 (0.71%) PMO
11 14 (0.48%) Accessibility
12 10 (0.34%) Actionable Recommendations
12 10 (0.34%) COBIT
13 8 (0.27%) IFRS
14 7 (0.24%) Cyber Essentials PLUS
14 7 (0.24%) SOC 2
15 5 (0.17%) ISO 9001
15 5 (0.17%) ISO/IEC 27002 (supersedes ISO/IEC 17799)
16 4 (0.14%) IFRS 17
16 4 (0.14%) NCSC
System Software
1 235 (7.98%) Active Directory
2 50 (1.70%) RACF
3 35 (1.19%) VMware Infrastructure
4 16 (0.54%) XenApp
4 16 (0.54%) XenDesktop
5 10 (0.34%) Virtual Machines
6 9 (0.31%) Hyper-V
7 8 (0.27%) Virtual Desktop
8 7 (0.24%) vSphere
9 5 (0.17%) Firmware
10 3 (0.10%) Embedded Firmware
10 3 (0.10%) Virtual Servers
11 2 (0.068%) Docker
12 1 (0.034%) BitLocker
12 1 (0.034%) Microsoft Virtual Server
12 1 (0.034%) Snort
12 1 (0.034%) VMware ESXi
Systems Management
1 60 (2.04%) Microsoft Intune
2 31 (1.05%) SCCM
3 16 (0.54%) Terraform
4 8 (0.27%) Nmap
5 7 (0.24%) PaperCut
5 7 (0.24%) QRadar
6 5 (0.17%) Backup Exec
6 5 (0.17%) Grafana
6 5 (0.17%) Kibana
6 5 (0.17%) Pingdom
6 5 (0.17%) Single Sign-On
6 5 (0.17%) Symantec Endpoint Protection
7 4 (0.14%) FortiGate
7 4 (0.14%) Jamf Pro
8 3 (0.10%) AirWatch
8 3 (0.10%) Nessus
8 3 (0.10%) Oracle Statspack
8 3 (0.10%) ZENworks
9 2 (0.068%) Kubernetes
9 2 (0.068%) Norton AntiVirus
Vendors
1 949 (32.24%) Microsoft
2 151 (5.13%) Databricks
3 103 (3.50%) SAP
4 63 (2.14%) Oracle
5 57 (1.94%) VMware
6 51 (1.73%) CyberArk
7 42 (1.43%) Google
8 36 (1.22%) Salesforce
9 32 (1.09%) Citrix
10 31 (1.05%) ServiceNow
11 29 (0.99%) Cisco
12 20 (0.68%) iManage
13 19 (0.65%) Adobe
13 19 (0.65%) IBM
14 15 (0.51%) Dell
14 15 (0.51%) Informatica
14 15 (0.51%) Workday
15 13 (0.44%) Fortinet
15 13 (0.44%) Veeam
16 12 (0.41%) Infor