Coaching Jobs with Hybrid/Remote/WFH Options

Coaching
UK > Work from Home

The table below provides summary statistics for permanent remote or hybrid work requiring Coaching skills. It includes a benchmarking guide to the annual salaries offered in vacancies that cited Coaching over the 6 months leading up to 15 March 2025, comparing them to the same period in the previous two years.

6 months to
15 Mar 2025
Same period 2024 Same period 2023
Rank 60 41 70
Rank change year-on-year -19 +29 -14
Permanent jobs citing Coaching 744 1,945 2,140
As % of all permanent jobs with a WFH option 4.60% 6.15% 4.61%
As % of the Processes & Methodologies category 4.90% 6.65% 4.80%
Number of salaries quoted 454 1,643 1,234
10th Percentile £38,750 £40,988 £45,000
25th Percentile £51,250 £45,250 £55,000
Median annual salary (50th Percentile) £65,000 £64,080 £69,447
Median % change year-on-year +1.44% -7.73% -0.79%
75th Percentile £82,500 £78,750 £85,000
90th Percentile £105,000 £86,250 £100,000
UK median annual salary £62,500 £61,206 £67,500
% change year-on-year +2.11% -9.32% +0.11%

All Process and Methodology Skills
Work from Home

Coaching falls under the Processes and Methodologies category. For comparison with the information above, the following table provides summary statistics for all permanent job vacancies with remote or hybrid options requiring process or methodology skills.

Permanent vacancies with a requirement for process or methodology skills 15,193 29,253 44,560
As % of all permanent jobs with a WFH option 94.01% 92.47% 95.96%
Number of salaries quoted 9,391 22,835 31,021
10th Percentile £32,500 £34,000 £37,500
25th Percentile £46,250 £42,500 £47,500
Median annual salary (50th Percentile) £60,000 £57,500 £62,500
Median % change year-on-year +4.35% -8.00% +4.17%
75th Percentile £80,000 £75,772 £82,500
90th Percentile £102,410 £95,000 £100,000
UK median annual salary £58,984 £55,000 £62,500
% change year-on-year +7.24% -12.00% +4.17%

Coaching
Trend for Jobs with a WFH Option

Job vacancies with remote working options citing Coaching as a proportion of all IT jobs advertised.
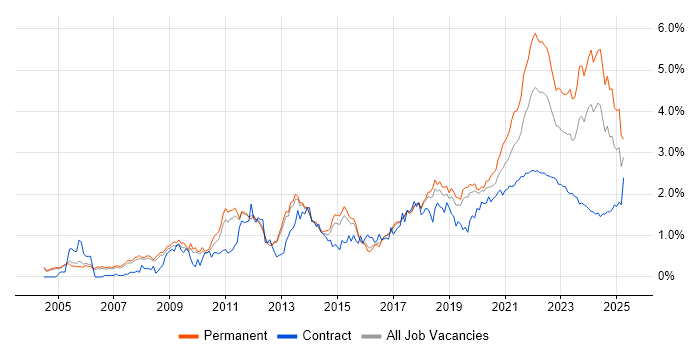
Coaching trend for jobs with Hybrid/Remote/WFH options

Coaching
Salary Trend for Jobs with a WFH Option

3-month moving average salary quoted in job vacancies with remote working options citing Coaching.

Coaching salary trend for jobs with a WFH option

Coaching
Salary Histogram for Jobs with a WFH Option

Salary distribution for jobs with remote working options citing Coaching over the 6 months to 15 March 2025.

Coaching salary histogram for jobs with a WFH option

Coaching
Co-occurring Skills and Capabilities with WFH Options by Category

The follow tables expand on the table above by listing co-occurrences grouped by category. The same employment type, locality and period is covered with up to 20 co-occurrences shown in each of the following categories:

Application Platforms
1 18 (2.42%) SharePoint
2 13 (1.75%) Confluence
3 10 (1.34%) Microsoft Exchange
4 7 (0.94%) Apache
5 3 (0.40%) NetWeaver
5 3 (0.40%) SAS
6 1 (0.13%) Apache Airflow
6 1 (0.13%) Apache Spark
6 1 (0.13%) CMS
6 1 (0.13%) Mule
6 1 (0.13%) OpenStack
6 1 (0.13%) ThingWorx
Applications
1 53 (7.12%) Microsoft Office
2 40 (5.38%) Simulink
3 35 (4.70%) Microsoft Excel
4 14 (1.88%) Microsoft PowerPoint
5 5 (0.67%) Microsoft Project
6 1 (0.13%) EngageOne
6 1 (0.13%) Trello
Business Applications
1 14 (1.88%) SAP S/4HANA
2 9 (1.21%) Oracle Retail
3 7 (0.94%) Oracle ERP
4 6 (0.81%) Oracle EBS
4 6 (0.81%) PeopleSoft HCM
5 5 (0.67%) SAP MDG
6 4 (0.54%) SAP HCM
7 3 (0.40%) CA PPM
8 2 (0.27%) Dynamics CRM
8 2 (0.27%) NEC Housing
8 2 (0.27%) OpenText VIM for SAP
8 2 (0.27%) PeopleSoft HRMS
8 2 (0.27%) Sage 50
8 2 (0.27%) SAP FI
9 1 (0.13%) Oracle Applications
9 1 (0.13%) SAP MDM
9 1 (0.13%) TIBCO iProcess
Cloud Services
1 139 (18.68%) Azure
2 109 (14.65%) AWS
3 52 (6.99%) Azure DevOps
4 50 (6.72%) GCP
5 45 (6.05%) Power Platform
6 44 (5.91%) SaaS
7 34 (4.57%) Microsoft 365
8 30 (4.03%) GitHub
8 30 (4.03%) Serverless
9 27 (3.63%) Dynamics 365
10 21 (2.82%) Amazon S3
10 21 (2.82%) AWS Lambda
11 20 (2.69%) Amazon SQS
12 19 (2.55%) PowerApps
13 10 (1.34%) GitHub Actions
14 8 (1.08%) Entra ID
15 7 (0.94%) Azure Data Factory
15 7 (0.94%) OCI
15 7 (0.94%) Smartsheet
16 6 (0.81%) Azure Synapse Analytics
Communications & Networking
1 28 (3.76%) Broadband
2 27 (3.63%) DNS
3 25 (3.36%) Wi-Fi
4 23 (3.09%) DHCP
5 19 (2.55%) Structured Cabling
5 19 (2.55%) Unified Communications
6 18 (2.42%) Firewall
7 15 (2.02%) WAN
8 12 (1.61%) Wireless
9 11 (1.48%) VPN
10 10 (1.34%) LAN
11 9 (1.21%) Network Security
11 9 (1.21%) SD-WAN
12 7 (0.94%) IPsec
13 6 (0.81%) WLAN
14 4 (0.54%) VLAN
15 3 (0.40%) Intranet
15 3 (0.40%) Intrusion Detection
15 3 (0.40%) VoIP
15 3 (0.40%) WebEx
Database & Business Intelligence
1 34 (4.57%) SQL Server
2 30 (4.03%) NoSQL
3 25 (3.36%) PostgreSQL
4 22 (2.96%) Power BI
5 21 (2.82%) Tableau
6 16 (2.15%) BigQuery
7 15 (2.02%) MongoDB
7 15 (2.02%) MySQL
8 14 (1.88%) Data Lake
9 12 (1.61%) Data Warehouse
10 11 (1.48%) Big Data
11 10 (1.34%) Relational Database
12 9 (1.21%) SQL Server Integration Services
13 8 (1.08%) RDBMS
14 6 (0.81%) Elasticsearch
15 5 (0.67%) Cloud Spanner
15 5 (0.67%) Looker
15 5 (0.67%) Oracle Database
16 4 (0.54%) Biml
16 4 (0.54%) Data Hub
Development Applications
1 31 (4.17%) Git
2 30 (4.03%) JIRA
3 28 (3.76%) Jenkins
4 11 (1.48%) GitLab
5 10 (1.34%) SonarQube
6 8 (1.08%) Gradle
7 6 (0.81%) Visual Studio
8 4 (0.54%) LSMW
8 4 (0.54%) Oracle Forms
8 4 (0.54%) Selenium
9 3 (0.40%) Maven
10 2 (0.27%) Artifactory
10 2 (0.27%) Cucumber
10 2 (0.27%) Postman
10 2 (0.27%) SoapUI
10 2 (0.27%) Subversion
10 2 (0.27%) Visual Studio Code
10 2 (0.27%) Xcode
10 2 (0.27%) XCTest
10 2 (0.27%) XCUITest
General
1 292 (39.25%) Social Skills
2 212 (28.49%) Finance
3 81 (10.89%) Analytical Skills
4 74 (9.95%) Inclusion and Diversity
5 65 (8.74%) Public Sector
6 63 (8.47%) Retail
7 62 (8.33%) Banking
8 49 (6.59%) Organisational Skills
9 48 (6.45%) Influencing Skills
10 43 (5.78%) Marketing
11 40 (5.38%) Aerospace
12 38 (5.11%) Tech for Good
13 34 (4.57%) Legal
14 26 (3.49%) Law
15 22 (2.96%) Publishing
16 21 (2.82%) Advertising
17 20 (2.69%) Health Technology
17 20 (2.69%) Presentation Skills
18 18 (2.42%) Games
19 8 (1.08%) Manufacturing
Job Titles
1 232 (31.18%) Senior
2 206 (27.69%) Lead
3 73 (9.81%) Team Leader
4 70 (9.41%) Developer
5 47 (6.32%) Analyst
5 47 (6.32%) Software Engineer
6 45 (6.05%) Systems Engineer
7 44 (5.91%) Senior Manager
7 44 (5.91%) Senior Systems Engineer
8 43 (5.78%) Lead Systems Engineer
9 37 (4.97%) Architect
10 32 (4.30%) Project Manager
11 31 (4.17%) Consultant
12 26 (3.49%) Lead Developer
13 25 (3.36%) Senior Developer
14 24 (3.23%) Delivery Manager
15 23 (3.09%) Technical Leader
16 22 (2.96%) Engineering Manager
16 22 (2.96%) Senior Architect
16 22 (2.96%) Service Analyst
Libraries, Frameworks & Software Standards
1 58 (7.80%) .NET
2 49 (6.59%) React
3 48 (6.45%) RESTful
4 41 (5.51%) AngularJS
5 19 (2.55%) Kafka
6 16 (2.15%) Node.js
7 15 (2.02%) .NET Core
8 14 (1.88%) React Native
9 12 (1.61%) .NET Framework
9 12 (1.61%) HTML
10 11 (1.48%) CSS
11 10 (1.34%) REST
11 10 (1.34%) Spring
12 9 (1.21%) Flutter
12 9 (1.21%) Ruby on Rails
12 9 (1.21%) Spring Boot
13 8 (1.08%) Unity (Game Engine)
14 7 (0.94%) Oracle Fusion
15 6 (0.81%) Electron
16 5 (0.67%) Vue
Miscellaneous
1 52 (6.99%) Management Information System
2 28 (3.76%) Product Ownership
2 28 (3.76%) Public Cloud
3 23 (3.09%) Self-Motivation
3 23 (3.09%) Video Conferencing
4 22 (2.96%) Legacy Systems
5 19 (2.55%) Digital Media
6 18 (2.42%) Blog
7 16 (2.15%) Private Cloud
8 14 (1.88%) Onboarding
9 12 (1.61%) Algorithms
9 12 (1.61%) Data Centre
9 12 (1.61%) Hybrid Cloud
9 12 (1.61%) Virtual Team
10 11 (1.48%) Enterprise Software
11 9 (1.21%) Cyber Security Posture
11 9 (1.21%) Data Structures
11 9 (1.21%) Mobile App
11 9 (1.21%) Security Posture
12 8 (1.08%) Distributed Architecture
Operating Systems
1 36 (4.84%) Windows
2 33 (4.44%) Linux
3 20 (2.69%) Apple iOS
4 17 (2.28%) Android
5 10 (1.34%) Windows 10
6 6 (0.81%) Unix
6 6 (0.81%) Windows Server
7 3 (0.40%) Data ONTAP
8 2 (0.27%) CoreOS
8 2 (0.27%) Oracle Linux
8 2 (0.27%) zOS
9 1 (0.13%) Debian
9 1 (0.13%) VMS
Processes & Methodologies
1 495 (66.53%) Mentoring
2 338 (45.43%) Agile
3 176 (23.66%) DevOps
4 164 (22.04%) Software Engineering
5 160 (21.51%) Project Management
6 141 (18.95%) Continuous Improvement
7 125 (16.80%) Technical Leadership
8 120 (16.13%) Problem-Solving
9 111 (14.92%) Line Management
10 107 (14.38%) CI/CD
11 91 (12.23%) Roadmaps
12 83 (11.16%) Service Delivery
13 76 (10.22%) Stakeholder Management
14 74 (9.95%) TDD
15 71 (9.54%) Project Delivery
16 69 (9.27%) Analytics
16 69 (9.27%) Customer Service
17 65 (8.74%) Microservices
18 63 (8.47%) Process Improvement
19 60 (8.06%) System Testing
Programming Languages
1 84 (11.29%) SQL
2 74 (9.95%) Python
3 68 (9.14%) Java
4 62 (8.33%) JavaScript
5 59 (7.93%) C#
6 33 (4.44%) TypeScript
7 15 (2.02%) Ruby
8 13 (1.75%) PowerShell
9 12 (1.61%) Kotlin
9 12 (1.61%) R
10 10 (1.34%) Swift
11 9 (1.21%) T-SQL
12 8 (1.08%) Objective-C
13 7 (0.94%) PHP
14 6 (0.81%) Go
14 6 (0.81%) Scala
15 5 (0.67%) ABAP
15 5 (0.67%) Bash
16 3 (0.40%) Apex Code
16 3 (0.40%) C++
Qualifications
1 110 (14.78%) Degree
2 54 (7.26%) Security Cleared
3 42 (5.65%) BPSS Clearance
4 36 (4.84%) SC Cleared
5 22 (2.96%) DBS Check
6 19 (2.55%) RIBA
7 12 (1.61%) Computer Science Degree
8 10 (1.34%) ACCA
9 9 (1.21%) HNC
9 9 (1.21%) HND
10 8 (1.08%) Cisco Certification
10 8 (1.08%) PMI Certification
11 7 (0.94%) Microsoft Certification
11 7 (0.94%) Oracle Certification
11 7 (0.94%) PMP
12 5 (0.67%) Master's Degree
13 4 (0.54%) Azure Certification
13 4 (0.54%) CCNA
14 3 (0.40%) CCNP
15 2 (0.27%) MCSE
Quality Assurance & Compliance
1 55 (7.39%) QA
2 35 (4.70%) Accessibility
3 19 (2.55%) PMO
4 16 (2.15%) SLA
5 15 (2.02%) Data Quality
6 12 (1.61%) ISO/IEC 27001
6 12 (1.61%) NIST
7 10 (1.34%) GDPR
8 8 (1.08%) ISO 9001
9 3 (0.40%) P3O
10 2 (0.27%) COBIT
10 2 (0.27%) Cyber Essentials
10 2 (0.27%) Cyber Essentials PLUS
10 2 (0.27%) ISO/IEC 17025
10 2 (0.27%) ISO/IEC 20000
10 2 (0.27%) NCSC
10 2 (0.27%) Solvency II
11 1 (0.13%) Actionable Recommendations
11 1 (0.13%) WCAG
System Software
1 43 (5.78%) Docker
2 21 (2.82%) Active Directory
3 3 (0.40%) VMware Infrastructure
4 2 (0.27%) Hyper-V
4 2 (0.27%) Virtual Machines
Systems Management
1 44 (5.91%) Kubernetes
2 24 (3.23%) Terraform
3 10 (1.34%) Ansible
4 6 (0.81%) Microsoft Intune
5 5 (0.67%) SCCM
6 3 (0.40%) Autotask
6 3 (0.40%) FortiGate
6 3 (0.40%) Puppet
7 2 (0.27%) CA Endevor
7 2 (0.27%) Progress Chef
7 2 (0.27%) Single Sign-On
8 1 (0.13%) CloudHub
8 1 (0.13%) Grafana
8 1 (0.13%) Istio
8 1 (0.13%) Prometheus
8 1 (0.13%) Systems Management Server (SMS)
Vendors
1 108 (14.52%) Microsoft
2 40 (5.38%) MathWorks
3 37 (4.97%) Google
4 23 (3.09%) SAP
5 21 (2.82%) Oracle
6 18 (2.42%) Dynatrace
7 15 (2.02%) Cisco
8 14 (1.88%) Salesforce
9 10 (1.34%) ServiceNow
10 8 (1.08%) Databricks
10 8 (1.08%) New Relic
11 7 (0.94%) Meraki
12 6 (0.81%) Adobe
12 6 (0.81%) Hyperion
12 6 (0.81%) JD Edwards
12 6 (0.81%) Palo Alto
12 6 (0.81%) PeopleSoft
12 6 (0.81%) TikTok
13 5 (0.67%) Sophos
14 4 (0.54%) VMware