Azure Jobs with Work from Home Options

Microsoft Azure
UK > Work from Home

The table below provides summary statistics for permanent remote or hybrid work requiring Azure skills. It includes a benchmarking guide to the annual salaries offered in vacancies that cited Azure over the 6 months leading up to 11 October 2024, comparing them to the same period in the previous two years.

6 months to
11 Oct 2024
Same period 2023 Same period 2022
Rank 5 4 6
Rank change year-on-year -1 +2 -1
Permanent jobs citing Azure 4,466 6,364 14,386
As % of all permanent jobs with a WFH option 18.82% 24.92% 22.27%
As % of the Cloud Services category 44.45% 51.28% 43.48%
Number of salaries quoted 2,847 4,813 9,496
10th Percentile £38,000 £38,837 £40,000
25th Percentile £46,900 £49,750 £48,250
Median annual salary (50th Percentile) £62,500 £62,500 £65,000
Median % change year-on-year - -3.85% +8.33%
75th Percentile £78,750 £80,000 £82,500
90th Percentile £95,000 £95,000 £98,750
UK median annual salary £62,500 £62,500 £65,000
% change year-on-year - -3.85% +8.33%

All Cloud Skills
Work from Home

Azure falls under the Cloud Services category. For comparison with the information above, the following table provides summary statistics for all permanent job vacancies with remote or hybrid options requiring cloud computing skills.

Permanent vacancies with a requirement for cloud computing skills 10,047 12,410 33,088
As % of all permanent jobs with a WFH option 42.34% 48.60% 51.22%
Number of salaries quoted 5,973 9,601 20,393
10th Percentile £36,500 £37,500 £37,500
25th Percentile £47,500 £48,750 £47,500
Median annual salary (50th Percentile) £65,000 £65,000 £65,000
Median % change year-on-year - - +8.33%
75th Percentile £86,250 £82,500 £85,000
90th Percentile £115,000 £100,000 £100,000
UK median annual salary £65,000 £62,500 £62,500
% change year-on-year +4.00% - +4.17%

Azure
Trend for Jobs with a WFH Option

Job vacancies with a work from home option citing Azure as a proportion of all IT jobs advertised.
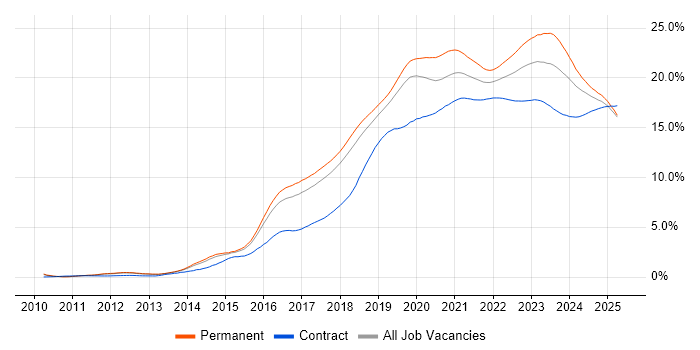
Azure trend for jobs with a WFH option

Azure
Salary Trend for Jobs with a WFH Option

3-month moving average salary quoted in job vacancies with a work from home option citing Azure.

Azure salary trend for jobs with a WFH option

Azure
Salary Histogram for Jobs with a WFH Option

Salary distribution for jobs with a work from home option citing Azure over the 6 months to 11 October 2024.

Azure salary histogram for jobs with a WFH option

Azure
Co-occurring Skills and Capabilities with WFH Options by Category

The follow tables expand on the table above by listing co-occurrences grouped by category. The same employment type, locality and period is covered with up to 20 co-occurrences shown in each of the following categories:

Application Platforms
1 286 (6.40%) SharePoint
2 234 (5.24%) Microsoft Exchange
3 62 (1.39%) IIS
4 58 (1.30%) Apache Airflow
5 43 (0.96%) Confluence
6 41 (0.92%) Apache Spark
7 28 (0.63%) Umbraco
8 24 (0.54%) Apache
9 23 (0.52%) WebLogic
10 21 (0.47%) CMS
11 12 (0.27%) nginx
12 9 (0.20%) NServiceBus
13 5 (0.11%) Tomcat
13 5 (0.11%) WordPress
14 4 (0.090%) ArcGIS
15 3 (0.067%) Blackberry Enterprise Server
15 3 (0.067%) Moodle
15 3 (0.067%) OpenStack
15 3 (0.067%) Oracle Workflow
15 3 (0.067%) Sitecore CMS
Applications
1 83 (1.86%) Microsoft Office
2 37 (0.83%) Microsoft Excel
3 34 (0.76%) Simulink
4 9 (0.20%) Microsoft PowerPoint
4 9 (0.20%) MS Visio
5 2 (0.045%) Microsoft Project
5 2 (0.045%) PrintSoft PReS
5 2 (0.045%) S-PLUS
6 1 (0.022%) 1Password
6 1 (0.022%) Adobe XD
6 1 (0.022%) Revit
6 1 (0.022%) Trello
Business Applications
1 81 (1.81%) Dynamics CRM
2 29 (0.65%) Sparx Enterprise Architect
3 13 (0.29%) Remedy ITSM
4 7 (0.16%) Dynamics NAV
5 4 (0.090%) Dynamics AX
5 4 (0.090%) Maximo
6 3 (0.067%) Dynamics GP
7 2 (0.045%) Magento
7 2 (0.045%) Oracle General Ledger
7 2 (0.045%) Oracle Subledger Accounting
7 2 (0.045%) Salesforce CRM
7 2 (0.045%) SAP S/4HANA
7 2 (0.045%) TIBCO iProcess
7 2 (0.045%) Unit4 Business World
8 1 (0.022%) MIS ActiveH
8 1 (0.022%) Payment Gateway
8 1 (0.022%) Sage X3
8 1 (0.022%) SAP ERP
8 1 (0.022%) SAP IS-U
8 1 (0.022%) TRIRIGA
Cloud Services
1 1,305 (29.22%) AWS
2 848 (18.99%) Microsoft 365
3 683 (15.29%) Azure DevOps
4 567 (12.70%) Entra ID
5 476 (10.66%) Power Platform
6 448 (10.03%) GCP
7 371 (8.31%) SaaS
8 202 (4.52%) Azure Data Factory
9 198 (4.43%) PaaS
10 182 (4.08%) Serverless
11 177 (3.96%) Azure Synapse Analytics
12 167 (3.74%) Dynamics 365
13 162 (3.63%) PowerApps
14 158 (3.54%) GitHub
15 154 (3.45%) IaaS
16 141 (3.16%) Azure Service Bus
17 138 (3.09%) Azure Logic Apps
17 138 (3.09%) Power Automate
18 102 (2.28%) Azure Cosmos DB
18 102 (2.28%) Cloud Computing
Communications & Networking
1 390 (8.73%) Firewall
2 312 (6.99%) DNS
3 183 (4.10%) Broadband
4 164 (3.67%) DHCP
5 160 (3.58%) VPN
6 155 (3.47%) TCP/IP
7 140 (3.13%) WAN
8 130 (2.91%) LAN
9 120 (2.69%) 5G
10 103 (2.31%) Wireless
11 93 (2.08%) Network Security
12 73 (1.63%) VLAN
13 68 (1.52%) Wi-Fi
14 62 (1.39%) SAN
15 57 (1.28%) Internet
16 51 (1.14%) BGP
17 49 (1.10%) SD-WAN
18 47 (1.05%) SSL
19 40 (0.90%) Intrusion Detection
20 39 (0.87%) VoIP
Database & Business Intelligence
1 554 (12.40%) SQL Server
2 344 (7.70%) Power BI
3 306 (6.85%) Data Warehouse
4 281 (6.29%) Data Lake
5 240 (5.37%) Azure SQL Database
6 214 (4.79%) NoSQL
7 145 (3.25%) Relational Database
8 124 (2.78%) PostgreSQL
9 112 (2.51%) MongoDB
10 94 (2.10%) MySQL
11 93 (2.08%) Amazon RDS
12 88 (1.97%) SQL Server Integration Services
13 76 (1.70%) Azure SQL Data Warehouse
14 67 (1.50%) Tableau
15 66 (1.48%) Elasticsearch
16 64 (1.43%) Amazon Athena
17 61 (1.37%) SQL Server Reporting Services
18 60 (1.34%) Big Data
19 48 (1.07%) Dremio
20 45 (1.01%) Amazon Redshift
Development Applications
1 343 (7.68%) Git
2 125 (2.80%) JIRA
3 111 (2.49%) Jenkins
4 82 (1.84%) GitLab
5 75 (1.68%) Visual Studio
6 64 (1.43%) Octopus Deploy
7 52 (1.16%) Team Foundation Server
8 41 (0.92%) Selenium
9 39 (0.87%) MSBuild
10 36 (0.81%) Vagrant
11 34 (0.76%) SonarQube
12 29 (0.65%) Bitbucket
13 24 (0.54%) Postman
14 21 (0.47%) Cypress.io
15 19 (0.43%) MSI
16 18 (0.40%) Subversion
17 16 (0.36%) TeamCity
18 11 (0.25%) SpecFlow
18 11 (0.25%) Visual Studio Code
19 10 (0.22%) MLflow
General
1 1,152 (25.79%) Social Skills
2 792 (17.73%) Finance
3 495 (11.08%) Analytical Skills
4 322 (7.21%) Inclusion and Diversity
5 192 (4.30%) Law
5 192 (4.30%) Public Sector
6 119 (2.66%) Banking
7 118 (2.64%) Legal
8 117 (2.62%) Retail
9 85 (1.90%) Marketing
9 85 (1.90%) Presentation Skills
10 67 (1.50%) Front Office
11 58 (1.30%) Automotive
12 51 (1.14%) Manufacturing
12 51 (1.14%) Organisational Skills
13 50 (1.12%) Advertising
14 46 (1.03%) Games
15 45 (1.01%) Back Office
16 40 (0.90%) Telecoms
17 38 (0.85%) Documentation Skills
Job Titles
1 1,016 (22.75%) Developer
2 934 (20.91%) Senior
3 464 (10.39%) Architect
4 410 (9.18%) Lead
5 401 (8.98%) Software Engineer
6 334 (7.48%) .NET Developer
7 321 (7.19%) Azure Engineer
8 307 (6.87%) Senior Developer
9 254 (5.69%) Data Engineer
10 250 (5.60%) Cloud Engineer
11 237 (5.31%) Infrastructure Engineer
12 235 (5.26%) Analyst
13 186 (4.16%) C# Developer
14 184 (4.12%) Consultant
14 184 (4.12%) Software Developer
15 177 (3.96%) Solutions Architect
16 157 (3.52%) Full-Stack Developer
17 134 (3.00%) Linux Specialist
17 134 (3.00%) Technical Specialist
18 132 (2.96%) Senior .NET Developer
Libraries, Frameworks & Software Standards
1 1,016 (22.75%) .NET
2 436 (9.76%) React
3 335 (7.50%) HTML
4 322 (7.21%) AngularJS
5 316 (7.08%) CSS
6 282 (6.31%) .NET Core
6 282 (6.31%) ASP.NET
7 260 (5.82%) .NET Framework
8 198 (4.43%) REST
9 187 (4.19%) RESTful
10 169 (3.78%) Node.js
11 149 (3.34%) Entity Framework
12 129 (2.89%) PySpark
13 105 (2.35%) Web Services
14 104 (2.33%) JSON
15 103 (2.31%) Vue
16 96 (2.15%) ASP.NET Web API
17 92 (2.06%) Blazor
18 91 (2.04%) ARM Templates
19 86 (1.93%) HTML5
Miscellaneous
1 155 (3.47%) Cloud Native
2 136 (3.05%) Social Media
3 125 (2.80%) Public Cloud
4 117 (2.62%) Product Ownership
5 110 (2.46%) Onboarding
6 106 (2.37%) Management Information System
7 105 (2.35%) Greenfield Project
8 101 (2.26%) Data Centre
9 91 (2.04%) Self-Motivation
10 72 (1.61%) Enterprise Software
11 69 (1.55%) Mobile App
12 66 (1.48%) Legacy Systems
13 58 (1.30%) Driving Licence
14 55 (1.23%) Hybrid Cloud
15 52 (1.16%) Data Structures
16 49 (1.10%) Private Cloud
17 45 (1.01%) Security Posture
18 44 (0.99%) Security Operations Centre
19 43 (0.96%) Replication
20 41 (0.92%) NHS
Operating Systems
1 750 (16.79%) Windows
2 482 (10.79%) Linux
3 395 (8.84%) Windows Server
4 201 (4.50%) Ubuntu
5 121 (2.71%) Windows 10
6 117 (2.62%) Android
7 83 (1.86%) Red Hat Enterprise Linux
8 72 (1.61%) Windows Server 2016
9 69 (1.55%) Apple iOS
10 66 (1.48%) Windows Server 2019
11 60 (1.34%) Unix
12 55 (1.23%) CentOS
13 36 (0.81%) Windows Server 2012
14 23 (0.52%) Mac OS
15 13 (0.29%) VMS
16 12 (0.27%) Windows 7
17 11 (0.25%) Solaris
18 10 (0.22%) Windows Server 2008
19 9 (0.20%) Mac OS X
19 9 (0.20%) SUSE
Processes & Methodologies
1 1,241 (27.79%) DevOps
2 1,187 (26.58%) Agile
3 840 (18.81%) Software Engineering
4 750 (16.79%) CI/CD
5 725 (16.23%) Problem-Solving
6 531 (11.89%) Mentoring
7 447 (10.01%) Microservices
8 429 (9.61%) Cybersecurity
9 426 (9.54%) Full-Stack Development
10 425 (9.52%) Artificial Intelligence
11 393 (8.80%) Analytics
12 375 (8.40%) Roadmaps
13 361 (8.08%) Infrastructure as Code
14 330 (7.39%) Business Intelligence
15 326 (7.30%) Infrastructure Engineering
16 322 (7.21%) Continuous Improvement
17 316 (7.08%) Computer Science
18 308 (6.90%) Scrum
19 293 (6.56%) Migration
20 286 (6.40%) TDD
Programming Languages
1 1,251 (28.01%) SQL
2 1,090 (24.41%) C#
3 796 (17.82%) Python
4 735 (16.46%) JavaScript
5 497 (11.13%) PowerShell
6 409 (9.16%) Java
7 276 (6.18%) TypeScript
8 264 (5.91%) Bash
9 150 (3.36%) T-SQL
10 97 (2.17%) Bicep
11 87 (1.95%) C++
12 62 (1.39%) PHP
13 60 (1.34%) Go
14 52 (1.16%) Kotlin
15 45 (1.01%) Kusto Query Language
16 43 (0.96%) R
17 33 (0.74%) VB.NET
18 27 (0.60%) Data Analysis Expressions
18 27 (0.60%) Perl
19 25 (0.56%) Scala
Qualifications
1 558 (12.49%) Degree
2 465 (10.41%) Security Cleared
3 340 (7.61%) SC Cleared
4 322 (7.21%) Azure Certification
5 259 (5.80%) Computer Science Degree
6 224 (5.02%) Microsoft Certification
7 125 (2.80%) AWS Certification
8 88 (1.97%) Cisco Certification
9 78 (1.75%) BPSS Clearance
10 60 (1.34%) DV Cleared
10 60 (1.34%) TOGAF Certification
11 52 (1.16%) CISSP
12 51 (1.14%) DBS Check
13 48 (1.07%) AWS Certified Solutions Architect
14 47 (1.05%) CCNA
15 46 (1.03%) CCNP
15 46 (1.03%) Master's Degree
16 32 (0.72%) CEH
17 30 (0.67%) AWS Certified Cloud Practitioner
18 28 (0.63%) CISM
Quality Assurance & Compliance
1 164 (3.67%) QA
2 122 (2.73%) ISO/IEC 27001
3 104 (2.33%) Data Quality
4 87 (1.95%) GDPR
5 67 (1.50%) SLA
6 66 (1.48%) Cyber Essentials
7 55 (1.23%) Accessibility
8 43 (0.96%) NIST
9 28 (0.63%) NCSC
10 26 (0.58%) PCI DSS
11 20 (0.45%) Cyber Essentials PLUS
12 14 (0.31%) HIPAA
13 13 (0.29%) SOC 2
14 10 (0.22%) ISO 9001
14 10 (0.22%) ISO/IEC 27002 (supersedes ISO/IEC 17799)
14 10 (0.22%) PMO
15 6 (0.13%) Solvency II
16 5 (0.11%) COBIT
16 5 (0.11%) GxP
16 5 (0.11%) NIST 800
System Software
1 799 (17.89%) Active Directory
2 425 (9.52%) Docker
3 242 (5.42%) VMware Infrastructure
4 172 (3.85%) Hyper-V
5 129 (2.89%) Virtual Machines
6 77 (1.72%) Virtual Desktop
7 45 (1.01%) vSphere
8 32 (0.72%) VMware ESXi
9 31 (0.69%) Virtual Servers
10 17 (0.38%) XenDesktop
11 15 (0.34%) XenApp
12 11 (0.25%) Firmware
13 8 (0.18%) NFS
14 7 (0.16%) NDS
14 7 (0.16%) NetIQ eDirectory
14 7 (0.16%) pfSense
15 6 (0.13%) Terminal Services
16 5 (0.11%) Ceph
17 4 (0.090%) BitLocker
17 4 (0.090%) Microsoft Virtual Server
Systems Management
1 469 (10.50%) Terraform
2 405 (9.07%) Kubernetes
3 383 (8.58%) Microsoft Intune
4 229 (5.13%) Ansible
5 139 (3.11%) Jamf Pro
6 76 (1.70%) SCCM
7 65 (1.46%) Grafana
8 62 (1.39%) Prometheus
9 40 (0.90%) Active Directory Federation Services
10 35 (0.78%) Single Sign-On
11 24 (0.54%) Puppet
12 23 (0.52%) SCOM
13 22 (0.49%) Nagios
14 21 (0.47%) FortiGate
15 18 (0.40%) vCenter Server
16 16 (0.36%) ZABBIX
17 15 (0.34%) Failover Clustering
18 14 (0.31%) Progress Chef
19 11 (0.25%) Nessus
19 11 (0.25%) WSUS
Vendors
1 1,759 (39.39%) Microsoft
2 345 (7.73%) VMware
3 265 (5.93%) Databricks
4 204 (4.57%) Google
5 177 (3.96%) Cisco
6 154 (3.45%) CyberArk
7 134 (3.00%) Tanium
8 104 (2.33%) Oracle
9 81 (1.81%) Citrix
10 67 (1.50%) Splunk
11 60 (1.34%) Meraki
12 59 (1.32%) ServiceNow
13 54 (1.21%) Veeam
14 51 (1.14%) Fortinet
14 51 (1.14%) Palo Alto
15 48 (1.07%) SAP
16 46 (1.03%) HP
16 46 (1.03%) Xamarin
17 40 (0.90%) Dell
18 37 (0.83%) IBM