Project Management Jobs with Hybrid/Remote/WFH Options

Project Management
UK > Work from Home

The table below provides summary statistics for permanent remote or hybrid work requiring Project Management skills. It includes a benchmarking guide to the annual salaries offered in vacancies that cited Project Management over the 6 months leading up to 12 July 2025, comparing them to the same period in the previous two years.

6 months to
12 Jul 2025
Same period 2024 Same period 2023
Rank 41 23 41
Rank change year-on-year -18 +18 -1
Permanent jobs citing Project Management 1,256 2,809 2,338
As % of all permanent jobs with a WFH option 5.97% 8.52% 6.67%
As % of the Processes & Methodologies category 6.43% 9.56% 6.95%
Number of salaries quoted 705 1,836 1,711
10th Percentile £33,750 £34,198 £39,000
25th Percentile £46,250 £42,000 £45,000
Median annual salary (50th Percentile) £57,500 £55,000 £57,396
Median % change year-on-year +4.55% -4.17% -0.18%
75th Percentile £73,750 £69,914 £68,750
90th Percentile £87,500 £85,000 £85,000
UK median annual salary £57,500 £52,500 £58,000
% change year-on-year +9.52% -9.48% +1.62%

All Process and Methodology Skills
Work from Home

Project Management falls under the Processes and Methodologies category. For comparison with the information above, the following table provides summary statistics for all permanent job vacancies with remote or hybrid options requiring process or methodology skills.

Permanent vacancies with a requirement for process or methodology skills 19,544 29,395 33,663
As % of all permanent jobs with a WFH option 92.90% 89.19% 95.99%
Number of salaries quoted 10,373 21,598 24,731
10th Percentile £25,313 £33,750 £37,500
25th Percentile £39,000 £42,500 £47,500
Median annual salary (50th Percentile) £57,500 £57,500 £62,500
Median % change year-on-year - -8.00% +4.17%
75th Percentile £76,250 £75,772 £81,250
90th Percentile £100,000 £95,000 £100,000
UK median annual salary £55,000 £55,000 £60,249
% change year-on-year - -8.71% +0.42%

Project Management
Trend for Jobs with a WFH Option

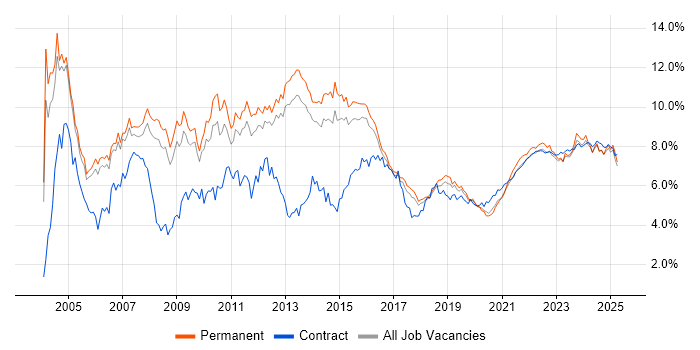
Job vacancies with remote working options citing Project Management as a proportion of all IT jobs advertised.

Project Management trend for jobs with Hybrid/Remote/WFH options

Project Management
Salary Trend for Jobs with a WFH Option

3-month moving average salary quoted in job vacancies with remote working options citing Project Management.

Project Management salary trend for jobs with a WFH option

Project Management
Salary Histogram for Jobs with a WFH Option

Salary distribution for jobs with remote working options citing Project Management over the 6 months to 12 July 2025.

Project Management salary histogram for jobs with a WFH option

Project Management
Co-occurring Skills and Capabilities with WFH Options by Category

The follow tables expand on the table above by listing co-occurrences grouped by category. The same employment type, locality and period is covered with up to 20 co-occurrences shown in each of the following categories:

Application Platforms
1 39 (3.11%) SharePoint
2 24 (1.91%) Microsoft Exchange
3 20 (1.59%) WordPress
4 19 (1.51%) CMS
5 17 (1.35%) Confluence
6 16 (1.27%) IIS
7 10 (0.80%) Moodle
8 9 (0.72%) Tomcat
9 8 (0.64%) PowerFactory
10 5 (0.40%) Apache
10 5 (0.40%) Drupal
11 2 (0.16%) Apache Spark
11 2 (0.16%) ThingWorx
11 2 (0.16%) Umbraco
12 1 (0.080%) Apache Airflow
12 1 (0.080%) Kentico
12 1 (0.080%) Skype for Business
Applications
1 121 (9.63%) Microsoft Office
2 64 (5.10%) Microsoft Excel
3 57 (4.54%) Microsoft Project
4 40 (3.18%) Simulink
5 32 (2.55%) Microsoft PowerPoint
6 21 (1.67%) MS Visio
7 15 (1.19%) Trello
8 4 (0.32%) Adobe Premiere
8 4 (0.32%) Notion
8 4 (0.32%) Spreadsheet
9 3 (0.24%) Final Cut Pro
10 2 (0.16%) Photoshop
11 1 (0.080%) Adobe Creative Suite
11 1 (0.080%) Adobe Illustrator
11 1 (0.080%) Adobe XD
11 1 (0.080%) AutoCAD
11 1 (0.080%) InDesign
11 1 (0.080%) Sketch
Business Applications
1 28 (2.23%) NetSuite
2 18 (1.43%) Sage 200
3 16 (1.27%) Sage CRM
4 15 (1.19%) SAP S/4HANA
5 11 (0.88%) Infor CloudSuite
5 11 (0.88%) Infor CloudSuite Industrial (formerly SyteLine)
6 10 (0.80%) Dynamics CRM
6 10 (0.80%) Salesforce CRM
7 9 (0.72%) Magento
8 8 (0.64%) SAP CO
8 8 (0.64%) SAP FI
8 8 (0.64%) SAP FI/CO
9 7 (0.56%) Oracle Assets
9 7 (0.56%) Oracle Cash Management
9 7 (0.56%) Oracle EBS
9 7 (0.56%) Oracle EBS R12
9 7 (0.56%) Oracle ERP
9 7 (0.56%) Oracle Payables
9 7 (0.56%) Oracle Receivables
10 6 (0.48%) Adaptiv
Cloud Services
1 150 (11.94%) Azure
2 81 (6.45%) Power Platform
3 73 (5.81%) Microsoft 365
4 64 (5.10%) SaaS
5 52 (4.14%) AWS
6 49 (3.90%) Azure DevOps
7 45 (3.58%) Power Automate
8 35 (2.79%) IaaS
9 34 (2.71%) Dynamics 365
9 34 (2.71%) Entra ID
10 26 (2.07%) PaaS
11 20 (1.59%) Azure Monitor
11 20 (1.59%) Google Analytics
12 18 (1.43%) Azure AI
13 17 (1.35%) Google Ads
14 16 (1.27%) Azure ExpressRoute
14 16 (1.27%) Azure Key Vault
14 16 (1.27%) Azure Service Bus
15 15 (1.19%) GitHub
15 15 (1.19%) Microsoft Copilot
Communications & Networking
1 39 (3.11%) Firewall
2 27 (2.15%) DNS
3 23 (1.83%) WAN
4 20 (1.59%) VPN
5 16 (1.27%) SD-WAN
6 11 (0.88%) SSL
7 10 (0.80%) SAN
7 10 (0.80%) TCP/IP
8 9 (0.72%) DMARC
9 8 (0.64%) Wireless
10 6 (0.48%) LAN
10 6 (0.48%) LoRaWAN
11 5 (0.40%) DHCP
11 5 (0.40%) Internet
12 4 (0.32%) Network Security
13 3 (0.24%) Unified Communications
14 2 (0.16%) Ethernet
14 2 (0.16%) HTTP
14 2 (0.16%) SNMP
14 2 (0.16%) VoIP
Database & Business Intelligence
1 68 (5.41%) Power BI
2 54 (4.30%) SQL Server
3 51 (4.06%) Big Data
4 22 (1.75%) Data Lake
4 22 (1.75%) Relational Database
5 19 (1.51%) MySQL
6 14 (1.11%) Data Warehouse
6 14 (1.11%) SQL Server Reporting Services
7 10 (0.80%) SAP BW
7 10 (0.80%) Tableau
8 9 (0.72%) Metadata
8 9 (0.72%) PostgreSQL
9 8 (0.64%) Crystal Reports
9 8 (0.64%) Electronic Patient Records
9 8 (0.64%) GIS
10 6 (0.48%) Hadoop
10 6 (0.48%) Power Query
11 5 (0.40%) Data Mining
11 5 (0.40%) SAP HANA
11 5 (0.40%) SQL Server Integration Services
Development Applications
1 103 (8.20%) JIRA
2 47 (3.74%) Git
3 9 (0.72%) Selenium
4 6 (0.48%) Visual Studio
5 5 (0.40%) SonarQube
6 3 (0.24%) Oracle Forms
7 2 (0.16%) Bitbucket
7 2 (0.16%) GitLab
8 1 (0.080%) Log4Net
8 1 (0.080%) Sourcetree
8 1 (0.080%) Subversion
8 1 (0.080%) Team Foundation Server
General
1 636 (50.64%) Social Skills
2 463 (36.86%) Finance
3 229 (18.23%) Analytical Skills
4 220 (17.52%) Marketing
5 135 (10.75%) Banking
6 111 (8.84%) Public Sector
7 100 (7.96%) Advertising
8 95 (7.56%) Inclusion and Diversity
9 93 (7.40%) Retail
10 79 (6.29%) Presentation Skills
11 71 (5.65%) Law
12 67 (5.33%) Organisational Skills
13 65 (5.18%) Legal
14 55 (4.38%) Manufacturing
15 51 (4.06%) Local Government
16 41 (3.26%) Aerospace
17 27 (2.15%) Telecoms
18 20 (1.59%) Electronics
18 20 (1.59%) Influencing Skills
19 16 (1.27%) Publishing
Job Titles
1 321 (25.56%) Senior
2 213 (16.96%) Project Manager
3 102 (8.12%) Lead
3 102 (8.12%) Senior Manager
4 98 (7.80%) Account Manager
5 83 (6.61%) Designer
6 82 (6.53%) Developer
7 81 (6.45%) Analyst
7 81 (6.45%) Senior Designer
8 79 (6.29%) Senior UX Designer
8 79 (6.29%) UX Designer
9 72 (5.73%) IT Manager
10 52 (4.14%) Systems Engineer
11 51 (4.06%) Senior Account Manager
12 49 (3.90%) Team Leader
13 45 (3.58%) IT Project Manager
14 44 (3.50%) Business Analyst
15 43 (3.42%) Senior Systems Engineer
16 40 (3.18%) Architect
16 40 (3.18%) Lead Systems Engineer
Libraries, Frameworks & Software Standards
1 37 (2.95%) HTML
2 31 (2.47%) .NET
3 23 (1.83%) XML
4 21 (1.67%) CSS
5 17 (1.35%) Web Services
6 16 (1.27%) JSON
7 14 (1.11%) SAML
8 12 (0.96%) React
9 11 (0.88%) Node.js
10 10 (0.80%) Middleware
11 9 (0.72%) EDI
11 9 (0.72%) HTML5
11 9 (0.72%) OAuth
11 9 (0.72%) REST
11 9 (0.72%) Restlet
11 9 (0.72%) SOAP
12 8 (0.64%) Flash
13 7 (0.56%) ARM Templates
14 5 (0.40%) .NET Framework
14 5 (0.40%) Azure Blueprints
Miscellaneous
1 93 (7.40%) Digital Media
2 89 (7.09%) Marketing Technology
3 74 (5.89%) Product Ownership
4 71 (5.65%) NHS
5 66 (5.25%) Management Information System
6 51 (4.06%) Data Centre
7 48 (3.82%) Self-Motivation
8 45 (3.58%) Social Media
9 42 (3.34%) Onboarding
10 38 (3.03%) PMI
11 23 (1.83%) Driving Licence
11 23 (1.83%) Virtual Team
12 19 (1.51%) Renewable Energy
13 18 (1.43%) Enterprise Software
14 16 (1.27%) Life Science
15 15 (1.19%) IoT
15 15 (1.19%) SCADA
16 13 (1.04%) Analytical Mindset
17 12 (0.96%) Learning Management System
18 11 (0.88%) Market Risk
Operating Systems
1 55 (4.38%) Windows
2 26 (2.07%) Windows Server
3 16 (1.27%) Linux
4 11 (0.88%) Unix
5 8 (0.64%) Windows Vista
6 6 (0.48%) Android
6 6 (0.48%) Apple iOS
6 6 (0.48%) Windows Server 2019
7 3 (0.24%) Windows 10
8 2 (0.16%) Mac OS
8 2 (0.16%) Mac OS X
8 2 (0.16%) Windows 7
8 2 (0.16%) Windows Server 2016
9 1 (0.080%) Windows Server 2003
9 1 (0.080%) Windows Server 2008
9 1 (0.080%) Windows Server 2012
Processes & Methodologies
1 458 (36.46%) Agile
2 285 (22.69%) Stakeholder Management
3 277 (22.05%) Project Delivery
4 238 (18.95%) Problem-Solving
5 216 (17.20%) Continuous Improvement
6 214 (17.04%) Mentoring
7 182 (14.49%) PRINCE2
8 178 (14.17%) Strategic Thinking
9 174 (13.85%) Collaborative Working
10 169 (13.46%) User Experience
11 154 (12.26%) Digital Marketing
12 140 (11.15%) Analytics
13 126 (10.03%) Artificial Intelligence
13 126 (10.03%) Process Improvement
13 126 (10.03%) Risk Management
14 124 (9.87%) Coaching
15 114 (9.08%) Roadmaps
16 112 (8.92%) ERP
16 112 (8.92%) Wireframes
17 111 (8.84%) CRM
Programming Languages
1 128 (10.19%) SQL
2 53 (4.22%) JavaScript
3 42 (3.34%) PowerShell
4 33 (2.63%) Python
5 28 (2.23%) C#
6 23 (1.83%) Java
7 18 (1.43%) Bicep
8 16 (1.27%) PHP
9 13 (1.04%) VBA
10 9 (0.72%) T-SQL
11 8 (0.64%) TypeScript
12 6 (0.48%) Bash
13 5 (0.40%) R
14 4 (0.32%) C
14 4 (0.32%) C++
15 3 (0.24%) Data Analysis Expressions
15 3 (0.24%) Progress 4GL
16 2 (0.16%) Fortran
16 2 (0.16%) Scala
17 1 (0.080%) Shell Script
Qualifications
1 240 (19.11%) Degree
2 104 (8.28%) PMI Certification
3 83 (6.61%) PMP
4 65 (5.18%) Security Cleared
5 51 (4.06%) BPSS Clearance
6 41 (3.26%) Computer Science Degree
6 41 (3.26%) DBS Check
7 25 (1.99%) Azure Certification
8 21 (1.67%) DV Cleared
8 21 (1.67%) PRINCE2 Practitioner
9 20 (1.59%) Master's Degree
10 18 (1.43%) SC Cleared
11 14 (1.11%) HND
11 14 (1.11%) ITIL Certification
12 12 (0.96%) CFA
13 10 (0.80%) Microsoft Certification
14 9 (0.72%) HNC
14 9 (0.72%) ISTQB
14 9 (0.72%) Postgraduate
15 8 (0.64%) APMG
Quality Assurance & Compliance
1 145 (11.54%) Accessibility
2 75 (5.97%) PMO
3 73 (5.81%) QA
4 39 (3.11%) GDPR
5 24 (1.91%) Data Quality
6 21 (1.67%) ISO/IEC 27001
7 19 (1.51%) SLA
8 8 (0.64%) WCAG
9 7 (0.56%) Cyber Essentials
9 7 (0.56%) HIPAA
9 7 (0.56%) ISO 9001
10 6 (0.48%) P3O
11 5 (0.40%) NCSC
11 5 (0.40%) SOC 2
12 3 (0.24%) IEC 61508
13 2 (0.16%) 21 CFR Part 11
13 2 (0.16%) GxP
13 2 (0.16%) ISO 13485
13 2 (0.16%) ISO 22301
13 2 (0.16%) ISO/IEC 20000
System Software
1 40 (3.18%) Active Directory
2 17 (1.35%) Virtual Machines
2 17 (1.35%) VMware Infrastructure
3 13 (1.04%) Docker
4 8 (0.64%) Hyper-V
5 5 (0.40%) VMware ESXi
6 1 (0.080%) Forefront TMG
6 1 (0.080%) ISA Server
6 1 (0.080%) Varnish
Systems Management
1 39 (3.11%) Single Sign-On
2 14 (1.11%) Microsoft Intune
3 11 (0.88%) Terraform
4 9 (0.72%) Kubernetes
5 6 (0.48%) Ansible
6 5 (0.40%) ZABBIX
7 3 (0.24%) Functional Safety
7 3 (0.24%) SmoothWall
8 2 (0.16%) Active Directory Federation Services
9 1 (0.080%) NetBackup
9 1 (0.080%) SCCM
9 1 (0.080%) SCOM
9 1 (0.080%) SCOrch
9 1 (0.080%) SCSM
Vendors
1 256 (20.38%) Microsoft
2 77 (6.13%) SAP
3 74 (5.89%) Google
4 43 (3.42%) Salesforce
5 41 (3.26%) Oracle
6 40 (3.18%) Adobe
6 40 (3.18%) MathWorks
7 27 (2.15%) VMware
8 24 (1.91%) Databricks
9 21 (1.67%) TikTok
10 19 (1.51%) Sage
11 18 (1.43%) Meraki
12 17 (1.35%) Cisco
13 16 (1.27%) Facebook
14 12 (0.96%) Infor
14 12 (0.96%) Murex
15 11 (0.88%) Dell
15 11 (0.88%) YouTube
16 10 (0.80%) HubSpot
16 10 (0.80%) MuleSoft