Hybrid/Remote Tableau Job Trends

Tableau
UK > Work from Home

The table below provides summary statistics and salary benchmarking for remote or hybrid work requiring Tableau skills. It covers permanent job vacancies from the 6 months leading up to 11 November 2025, with comparisons to the same periods in the previous two years.

6 months to
11 Nov 2025
Same period 2024 Same period 2023
Rank 229 215 216
Rank change year-on-year -14 +1 0
Permanent jobs citing Tableau 161 284 317
As % of all permanent jobs with remote/hybrid work options 1.03% 1.45% 1.44%
As % of the Database & Business Intelligence category 6.97% 6.37% 5.76%
Number of salaries quoted 107 126 258
10th Percentile £37,500 £41,250 £41,500
25th Percentile £38,934 £52,500 £46,787
Median annual salary (50th Percentile) £52,500 £70,000 £60,000
Median % change year-on-year -25.00% +16.67% +9.09%
75th Percentile £70,000 £92,500 £84,056
90th Percentile £88,000 £122,500 £87,000
UK median annual salary £50,000 £65,000 £60,000
% change year-on-year -23.08% +8.33% +9.09%

All Database and Business Intelligence Skills
Work from Home

Tableau falls under the Databases and Business Intelligence category. For comparison with the information above, the following table provides summary statistics for all permanent job vacancies with remote or hybrid options requiring database or business intelligence skills.

Permanent vacancies with a requirement for database or business intelligence skills 2,309 4,458 5,501
As % of all permanent jobs with a WFH option 14.70% 22.76% 25.00%
Number of salaries quoted 1,776 2,684 4,398
10th Percentile £35,500 £39,750 £39,579
25th Percentile £45,000 £48,750 £47,500
Median annual salary (50th Percentile) £60,000 £70,000 £60,000
Median % change year-on-year -14.29% +16.67% -
75th Percentile £80,000 £95,000 £77,715
90th Percentile £110,000 £122,500 £94,500
UK median annual salary £60,000 £65,000 £60,000
% change year-on-year -7.69% +8.33% -4.00%

Tableau
Job Vacancy Trend for Remote/Hybrid Jobs

Historical trend showing the proportion of permanent IT job postings citing Tableau and offering remote or hybrid work options relative to all permanent IT jobs advertised.
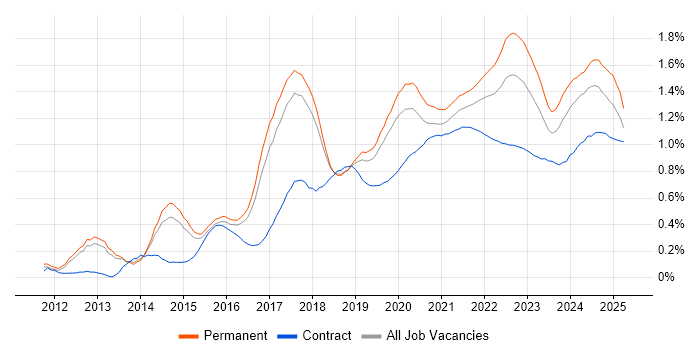
Tableau job vacancy trend for remote/hybrid jobs

Tableau
Salary Trend for Remote/Hybrid Jobs

Salary distribution trend for jobs with remote/hybrid work options citing Tableau.

Salary distribution trend for jobs with remote/hybrid work options citing Tableau

Tableau
Salary Histogram for Remote/Hybrid Jobs

Salary distribution for jobs with remote/hybrid work options citing Tableau over the 6 months to 11 November 2025.

Tableau salary histogram for jobs with remote/hybrid work options

Tableau
Co-Occurring Skills & Capabilities in Remote/Hybrid Jobs by Category

The following tables expand on the one above by listing co-occurrences grouped by category. They cover the same employment type, locality and period, with up to 20 co-occurrences shown in each category:

Application Platforms
1 14 (8.70%) Confluence
2 10 (6.21%) Oracle SOA Suite
3 5 (3.11%) Apache Airflow
4 2 (1.24%) Apache
5 1 (0.62%) Apache Spark
5 1 (0.62%) Jupyter
5 1 (0.62%) SAS
5 1 (0.62%) SharePoint
Applications
1 56 (34.78%) Microsoft Excel
2 7 (4.35%) Microsoft Office
3 1 (0.62%) Microsoft PowerPoint
Business Applications
1 12 (7.45%) Oracle ERP
2 4 (2.48%) Dynamics CRM
3 2 (1.24%) ResourceLink
Cloud Services
1 134 (83.23%) Power Platform
2 43 (26.71%) Azure
3 35 (21.74%) Snowflake
4 31 (19.25%) Azure DevOps
5 22 (13.66%) GCP
6 19 (11.80%) GitHub
7 18 (11.18%) AWS
8 11 (6.83%) GitHub Copilot
8 11 (6.83%) SaaS
9 10 (6.21%) OCI
10 8 (4.97%) dbt
11 7 (4.35%) Collibra
12 5 (3.11%) Amazon SageMaker
12 5 (3.11%) Azure Machine Learning
12 5 (3.11%) Google Analytics
13 4 (2.48%) Alation
13 4 (2.48%) Dynamics 365
13 4 (2.48%) Fivetran
13 4 (2.48%) GitHub Actions
13 4 (2.48%) Google Data Studio
Communications & Networking
1 2 (1.24%) Broadband
Database & Business Intelligence
1 134 (83.23%) Power BI
2 27 (16.77%) Data Warehouse
3 21 (13.04%) BigQuery
4 16 (9.94%) Looker
5 13 (8.07%) SQL Server
6 11 (6.83%) Metadata
7 7 (4.35%) Data Lake
7 7 (4.35%) MySQL
7 7 (4.35%) QlikView
8 5 (3.11%) Amazon Redshift
8 5 (3.11%) BusinessObjects
8 5 (3.11%) Power Query
9 4 (2.48%) Azure SQL Data Warehouse
9 4 (2.48%) Crystal Reports
9 4 (2.48%) DataStage
9 4 (2.48%) Mixpanel
9 4 (2.48%) Qlik Sense
10 2 (1.24%) Data Mining
10 2 (1.24%) SQL Server Integration Services
10 2 (1.24%) SQL Server Reporting Services
Development Applications
1 27 (16.77%) JIRA
2 17 (10.56%) Git
3 11 (6.83%) Jenkins
4 10 (6.21%) Oracle Forms
5 4 (2.48%) ER Studio
5 4 (2.48%) ERwin
5 4 (2.48%) PowerDesigner
6 2 (1.24%) JMeter
6 2 (1.24%) LoadRunner
6 2 (1.24%) Selenium
6 2 (1.24%) SonarQube
7 1 (0.62%) SQL Server Management Studio (SSMS)
7 1 (0.62%) Subversion
General
1 82 (50.93%) Finance
2 66 (40.99%) Analytical Skills
3 59 (36.65%) Social Skills
4 40 (24.84%) Marketing
5 19 (11.80%) Retail
6 11 (6.83%) Banking
7 9 (5.59%) Manufacturing
8 7 (4.35%) Inclusion and Diversity
9 5 (3.11%) Influencing Skills
9 5 (3.11%) Legal
9 5 (3.11%) Public Sector
10 4 (2.48%) Advertising
10 4 (2.48%) Retail Banking
10 4 (2.48%) Social Housing
11 3 (1.86%) Electronics
11 3 (1.86%) Investment Banking
11 3 (1.86%) Local Government
11 3 (1.86%) Pharmaceutical
12 2 (1.24%) Games
12 2 (1.24%) Telecoms
Job Titles
1 68 (42.24%) Analyst
2 24 (14.91%) Developer
3 23 (14.29%) Data Analyst
4 16 (9.94%) Business Intelligence Analyst
4 16 (9.94%) Business Intelligence Developer
4 16 (9.94%) Senior
5 13 (8.07%) Business Analyst
6 12 (7.45%) Digital Analyst
7 11 (6.83%) Analyst Developer
7 11 (6.83%) Customer Analyst
7 11 (6.83%) Data Engineer
7 11 (6.83%) Digital Analytics Analyst
8 10 (6.21%) Applications Engineer
8 10 (6.21%) Cloud Engineer
9 8 (4.97%) Analytics Developer
9 8 (4.97%) Business Intelligence Data Analyst
9 8 (4.97%) Digital Analytics Developer
9 8 (4.97%) Digital Developer
10 7 (4.35%) Analytics Manager
10 7 (4.35%) Internal Audit Manager
Libraries, Frameworks & Software Standards
1 10 (6.21%) OAuth
1 10 (6.21%) OAuth2
1 10 (6.21%) RESTful
1 10 (6.21%) SAML
2 7 (4.35%) Pandas
3 6 (3.73%) scikit-learn
4 5 (3.11%) Hugging Face
4 5 (3.11%) NumPy
5 4 (2.48%) Kafka
6 2 (1.24%) JSON
6 2 (1.24%) Middleware
6 2 (1.24%) PySpark
6 2 (1.24%) XML
7 1 (0.62%) CSS
7 1 (0.62%) Flask
7 1 (0.62%) LangChain
7 1 (0.62%) LightGBM
7 1 (0.62%) PyTorch
7 1 (0.62%) TensorFlow
7 1 (0.62%) XGBoost
Miscellaneous
1 22 (13.66%) Management Information System
2 16 (9.94%) Onboarding
3 14 (8.70%) Product Ownership
4 11 (6.83%) Analytical Mindset
5 10 (6.21%) Cloud Native
5 10 (6.21%) Enterprise Software
6 4 (2.48%) FMCG
6 4 (2.48%) Freedom of Information
6 4 (2.48%) Reinsurance
7 3 (1.86%) Data Protection Act
7 3 (1.86%) Greenfield Project
7 3 (1.86%) Housing Association
7 3 (1.86%) Podcast
7 3 (1.86%) Self-Motivation
8 2 (1.24%) Algorithms
8 2 (1.24%) Social Media
9 1 (0.62%) Data Structures
9 1 (0.62%) Hackathon
9 1 (0.62%) Legacy Systems
9 1 (0.62%) Over-the-Top Content
Operating Systems
1 7 (4.35%) Linux
1 7 (4.35%) Unix
1 7 (4.35%) Windows
Processes & Methodologies
1 132 (81.99%) Business Intelligence
2 103 (63.98%) Analytics
3 88 (54.66%) Visualisation
4 77 (47.83%) Data Visualisation
5 61 (37.89%) Decision-Making
6 48 (29.81%) Problem-Solving
7 46 (28.57%) Continuous Improvement
8 43 (26.71%) AI
9 41 (25.47%) Actionable Insight
9 41 (25.47%) DevOps
10 40 (24.84%) Agile
11 38 (23.60%) Data Management
12 30 (18.63%) Data Analytics
13 29 (18.01%) Data Analysis
14 28 (17.39%) Data Science
15 26 (16.15%) Coaching
16 25 (15.53%) CRM
16 25 (15.53%) Data Governance
16 25 (15.53%) ETL
17 23 (14.29%) Asset Management
Programming Languages
1 120 (74.53%) SQL
2 76 (47.20%) Python
3 18 (11.18%) R
4 12 (7.45%) Java
5 10 (6.21%) PL/SQL
5 10 (6.21%) Shell Script
6 7 (4.35%) Data Analysis Expressions
7 3 (1.86%) JavaScript
8 2 (1.24%) T-SQL
8 2 (1.24%) VBA
9 1 (0.62%) Julia
9 1 (0.62%) Scala
Qualifications
1 46 (28.57%) Degree
2 12 (7.45%) CISA
2 12 (7.45%) CISSP
2 12 (7.45%) Numerate Degree
3 9 (5.59%) Computer Science Degree
4 7 (4.35%) ACCA
4 7 (4.35%) CIMA
4 7 (4.35%) DBS Check
4 7 (4.35%) Master's Degree
5 5 (3.11%) Azure Certification
5 5 (3.11%) CISM
5 5 (3.11%) CRISC
5 5 (3.11%) Security Cleared
6 3 (1.86%) SC Cleared
7 2 (1.24%) DV Cleared
8 1 (0.62%) Chartered Engineer
8 1 (0.62%) ISACA
8 1 (0.62%) PhD
8 1 (0.62%) Six Sigma Yellow Belt
8 1 (0.62%) Tableau Certification
Quality Assurance & Compliance
1 23 (14.29%) Data Quality
2 13 (8.07%) ISO/IEC 27001
3 8 (4.97%) Accessibility
4 7 (4.35%) GDPR
5 6 (3.73%) QA
6 5 (3.11%) COBIT
6 5 (3.11%) GRC
6 5 (3.11%) ITGC
6 5 (3.11%) NIST
7 1 (0.62%) Actionable Recommendations
System Software
1 3 (1.86%) Docker
Systems Management
1 16 (9.94%) Terraform
2 10 (6.21%) Single Sign-On
3 2 (1.24%) Control-M
3 2 (1.24%) HP Fortify
3 2 (1.24%) Kubernetes
Vendors
1 28 (17.39%) Microsoft
2 26 (16.15%) Google
3 20 (12.42%) Oracle
3 20 (12.42%) Salesforce
4 15 (9.32%) Alteryx
5 9 (5.59%) Informatica
6 8 (4.97%) Databricks
7 6 (3.73%) IBM
8 5 (3.11%) Talend
9 4 (2.48%) Amplitude
9 4 (2.48%) Cognos
9 4 (2.48%) HubSpot
9 4 (2.48%) OpenAI
9 4 (2.48%) Salesforce Marketing Cloud
9 4 (2.48%) SAP
9 4 (2.48%) Zoho
10 3 (1.86%) Teradata
11 2 (1.24%) YouTube
12 1 (0.62%) dotdigital
12 1 (0.62%) TikTok