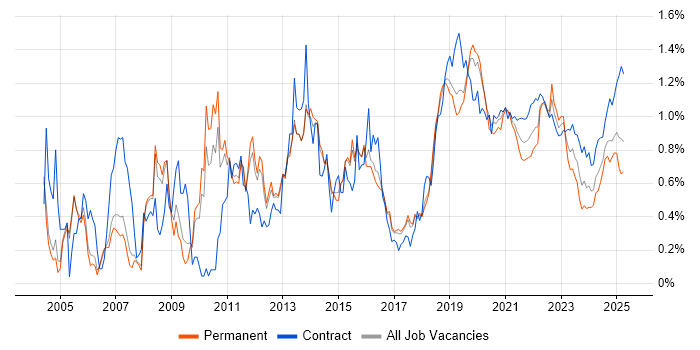
Legacy Systems Jobs with Work from Home Options

Legacy System
UK > Work from Home

The table below looks at the prevalence of the term Legacy Systems in remote or hybrid work. Included is a benchmarking guide to the salaries offered in vacancies that cited Legacy Systems over the 6 months leading up to 26 July 2024, comparing them to the same period in the previous two years.

6 months to
26 Jul 2024
Same period 2023 Same period 2022
Rank 397 317 353
Rank change year-on-year -80 +36 -55
Permanent jobs citing Legacy Systems 139 298 773
As % of all permanent jobs with a WFH option 0.50% 0.91% 0.98%
As % of the Miscellaneous category 1.45% 2.34% 2.11%
Number of salaries quoted 93 164 390
10th Percentile £38,750 £39,318 £42,425
25th Percentile £47,500 £52,500 £55,000
Median annual salary (50th Percentile) £52,500 £68,750 £70,000
Median % change year-on-year -23.64% -1.79% +16.67%
75th Percentile £72,500 £97,290 £92,500
90th Percentile £82,500 £121,500 £100,640
UK median annual salary £60,000 £65,000 £65,000
% change year-on-year -7.69% - +8.33%

All Generic Skills
Work from Home

Legacy Systems falls under the General and Transferable Skills category. For comparison with the information above, the following table provides summary statistics for all permanent job vacancies with remote or hybrid options requiring generic IT skills.

Permanent vacancies with a requirement for generic IT skills 9,605 12,729 36,632
As % of all permanent jobs with a WFH option 34.38% 38.79% 46.65%
Number of salaries quoted 6,855 9,924 18,426
10th Percentile £33,500 £40,000 £37,500
25th Percentile £45,000 £50,000 £47,500
Median annual salary (50th Percentile) £60,000 £65,000 £65,000
Median % change year-on-year -7.69% - +8.33%
75th Percentile £83,750 £85,000 £85,000
90th Percentile £117,500 £107,500 £100,000
UK median annual salary £55,000 £64,000 £62,500
% change year-on-year -14.06% +2.40% +4.17%

Legacy Systems
Trend for Jobs with a WFH Option

Job vacancies with a work from home option citing Legacy Systems as a proportion of all IT jobs advertised.

Legacy Systems trend for jobs with a WFH option

Legacy Systems
Salary Trend for Jobs with a WFH Option

3-month moving average salary quoted in job vacancies with a work from home option citing Legacy Systems.

Legacy Systems salary trend for jobs with a WFH option

Legacy Systems
Salary Histogram for Jobs with a WFH Option

Salary distribution for jobs with a work from home option citing Legacy Systems over the 6 months to 26 July 2024.

Legacy Systems salary histogram for jobs with a WFH option

Legacy Systems
Co-occurring Skills and Capabilities with WFH Options by Category

The follow tables expand on the table above by listing co-occurrences grouped by category. The same employment type, locality and period is covered with up to 20 co-occurrences shown in each of the following categories:

Application Platforms
1 22 (15.83%) SAS
2 6 (4.32%) SharePoint
3 4 (2.88%) IIS
4 3 (2.16%) CMS
5 1 (0.72%) Apache
5 1 (0.72%) Apache Airflow
5 1 (0.72%) Apache Solr
5 1 (0.72%) Apache Spark
5 1 (0.72%) Confluence
5 1 (0.72%) Mendix
Applications
1 5 (3.60%) Microsoft Excel
2 4 (2.88%) Microsoft PowerPoint
3 3 (2.16%) Adobe Illustrator
4 2 (1.44%) Microsoft Office
4 2 (1.44%) MS Visio
5 1 (0.72%) Adobe XD
Business Applications
1 5 (3.60%) Dynamics CRM
2 2 (1.44%) Odoo
2 2 (1.44%) SAP Business One
3 1 (0.72%) Dynamics AX
3 1 (0.72%) SAP MDG
3 1 (0.72%) SAP MDM
3 1 (0.72%) SAP Retail
3 1 (0.72%) SAP S/4HANA
Cloud Services
1 33 (23.74%) Azure
2 14 (10.07%) Power Platform
3 13 (9.35%) GCP
4 11 (7.91%) Microsoft 365
5 10 (7.19%) AWS
6 9 (6.47%) GitHub
7 8 (5.76%) Power Automate
7 8 (5.76%) PowerApps
8 6 (4.32%) Azure DevOps
8 6 (4.32%) Dynamics 365
9 5 (3.60%) SaaS
10 4 (2.88%) Serverless
10 4 (2.88%) Snowflake
11 3 (2.16%) Sage Pay
12 2 (1.44%) Cloud Computing
12 2 (1.44%) Figma
13 1 (0.72%) Azure Functions
13 1 (0.72%) Azure Logic Apps
13 1 (0.72%) Azure Synapse Analytics
13 1 (0.72%) PaaS
Communications & Networking
1 3 (2.16%) TCP/IP
2 2 (1.44%) 4G
2 2 (1.44%) Multicast
3 1 (0.72%) DHCP
3 1 (0.72%) DNS
3 1 (0.72%) Network Security
Database & Business Intelligence
1 18 (12.95%) SQL Server
2 14 (10.07%) MySQL
3 13 (9.35%) Power BI
4 11 (7.91%) Relational Database
5 6 (4.32%) NoSQL
6 5 (3.60%) Data Lake
6 5 (3.60%) Tableau
7 4 (2.88%) MS Access
8 3 (2.16%) Adabas
8 3 (2.16%) Big Data
8 3 (2.16%) Data Warehouse
9 2 (1.44%) PostgreSQL
9 2 (1.44%) Qlik Sense
10 1 (0.72%) Amazon Redshift
10 1 (0.72%) BigQuery
10 1 (0.72%) Data Mining
10 1 (0.72%) DTS
10 1 (0.72%) MariaDB
10 1 (0.72%) MongoDB
10 1 (0.72%) RDBMS
Development Applications
1 16 (11.51%) Git
2 10 (7.19%) JIRA
3 4 (2.88%) Jenkins
4 2 (1.44%) Apache Continuum
4 2 (1.44%) Balsamiq
4 2 (1.44%) Bitbucket
4 2 (1.44%) Rational DOORS
4 2 (1.44%) Team Foundation Server
5 1 (0.72%) IntelliJ
5 1 (0.72%) NUnit
5 1 (0.72%) SQL Server Management Studio (SSMS)
5 1 (0.72%) Visual Studio
5 1 (0.72%) VSS/SourceSafe
General
1 33 (23.74%) Social Skills
2 20 (14.39%) Analytical Skills
3 12 (8.63%) Finance
4 11 (7.91%) Law
5 6 (4.32%) Legal
5 6 (4.32%) Local Government
5 6 (4.32%) Retail
6 3 (2.16%) Inclusion and Diversity
6 3 (2.16%) Manufacturing
6 3 (2.16%) Marketing
6 3 (2.16%) Telecoms
7 2 (1.44%) Aerospace
7 2 (1.44%) Games
7 2 (1.44%) Organisational Skills
8 1 (0.72%) Automotive
8 1 (0.72%) Digital Health
8 1 (0.72%) Health Technology
8 1 (0.72%) Public Sector
8 1 (0.72%) Social Science
8 1 (0.72%) Tech for Good
Job Titles
1 88 (63.31%) Developer
2 22 (15.83%) ServiceNow Developer
3 18 (12.95%) .NET Developer
4 13 (9.35%) FoxPro Developer
4 13 (9.35%) PHP Developer
5 12 (8.63%) Senior
6 11 (7.91%) Senior Developer
7 10 (7.19%) Lead
8 9 (6.47%) Senior .NET Developer
8 9 (6.47%) Web Developer
9 8 (5.76%) Consultant
10 6 (4.32%) Analyst
10 6 (4.32%) Software Engineer
11 5 (3.60%) Architect
11 5 (3.60%) C# .NET Developer
11 5 (3.60%) C# Developer
12 4 (2.88%) Applications Developer
12 4 (2.88%) DevOps Engineer
12 4 (2.88%) SQL Developer
12 4 (2.88%) Web Applications Developer
Libraries, Frameworks & Software Standards
1 58 (41.73%) HTML
2 53 (38.13%) CSS
3 32 (23.02%) .NET
4 27 (19.42%) Web Services
5 24 (17.27%) Twitter Bootstrap
6 23 (16.55%) AngularJS
7 15 (10.79%) HTML5
8 13 (9.35%) Laravel
8 13 (9.35%) Symfony
9 12 (8.63%) jQuery
10 11 (7.91%) REST
11 10 (7.19%) .NET Framework
11 10 (7.19%) ASP.NET Web Forms
11 10 (7.19%) SOAP
12 9 (6.47%) CSS3
13 8 (5.76%) RabbitMQ
14 6 (4.32%) ASP.NET
15 5 (3.60%) .NET Core
15 5 (3.60%) RESTful
16 4 (2.88%) ASP.NET MVC
Miscellaneous
1 22 (15.83%) CMDB
2 12 (8.63%) Greenfield Project
3 5 (3.60%) Cloud Native
3 5 (3.60%) Team-Oriented Environment
4 4 (2.88%) Data Structures
4 4 (2.88%) Legacy Applications
4 4 (2.88%) Management Information System
5 3 (2.16%) Blog
5 3 (2.16%) Graphic Design
5 3 (2.16%) IBM Mainframe
5 3 (2.16%) Mainframe
5 3 (2.16%) Onboarding
5 3 (2.16%) Social Media
6 2 (1.44%) Client/Server
6 2 (1.44%) Distributed Systems
6 2 (1.44%) PMI
6 2 (1.44%) Self-Motivation
7 1 (0.72%) Clustering
7 1 (0.72%) Replication
7 1 (0.72%) Video Conferencing
Operating Systems
1 7 (5.04%) Linux
2 4 (2.88%) Android
2 4 (2.88%) Apple iOS
3 3 (2.16%) Windows
3 3 (2.16%) zOS
Processes & Methodologies
1 31 (22.30%) Code Quality
2 28 (20.14%) Problem-Solving
3 26 (18.71%) Service Catalogue
4 23 (16.55%) Continuous Improvement
5 22 (15.83%) Actionable Insight
5 22 (15.83%) Change Management
5 22 (15.83%) ChatOps
5 22 (15.83%) Incident Management
5 22 (15.83%) ITSM
5 22 (15.83%) Problem Management
5 22 (15.83%) Root Cause Analysis
5 22 (15.83%) Security Operations
5 22 (15.83%) Service Management
6 21 (15.11%) Agile
7 17 (12.23%) Software Engineering
8 16 (11.51%) Migration
9 15 (10.79%) DevOps
9 15 (10.79%) High Availability
9 15 (10.79%) Microservices
9 15 (10.79%) Web Development
Programming Languages
1 40 (28.78%) SQL
2 37 (26.62%) JavaScript
3 24 (17.27%) C#
4 14 (10.07%) PHP
5 13 (9.35%) FoxPro (VFP)
6 10 (7.19%) Python
7 9 (6.47%) Go
8 6 (4.32%) VBA
9 5 (3.60%) Java
9 5 (3.60%) T-SQL
10 4 (2.88%) VB
11 3 (2.16%) Ada
11 3 (2.16%) JCL
11 3 (2.16%) Natural
11 3 (2.16%) PowerShell
11 3 (2.16%) REXX
11 3 (2.16%) Rust
11 3 (2.16%) TypeScript
11 3 (2.16%) VB.NET
12 2 (1.44%) R
Qualifications
1 9 (6.47%) Degree
2 8 (5.76%) SC Cleared
2 8 (5.76%) Security Cleared
3 5 (3.60%) Computer Science Degree
3 5 (3.60%) PMI Certification
4 3 (2.16%) PMP
5 2 (1.44%) AWS Certification
5 2 (1.44%) CBAP
5 2 (1.44%) DBS Check
5 2 (1.44%) IIBA
6 1 (0.72%) AWS Certified Solutions Architect
6 1 (0.72%) Microsoft Certification
Quality Assurance & Compliance
1 13 (9.35%) QA
2 2 (1.44%) California Consumer Privacy Act
2 2 (1.44%) Data Quality
2 2 (1.44%) GDPR
3 1 (0.72%) Accessibility
3 1 (0.72%) GAMP
3 1 (0.72%) PMO
System Software
1 10 (7.19%) Docker
2 5 (3.60%) Active Directory
Systems Management
1 3 (2.16%) Ansible
2 2 (1.44%) Terraform
3 1 (0.72%) Grafana
3 1 (0.72%) HP ALM
3 1 (0.72%) Kubernetes
3 1 (0.72%) MIIS
3 1 (0.72%) Prometheus
Vendors
1 32 (23.02%) Microsoft
2 22 (15.83%) ServiceNow
3 5 (3.60%) Oracle
3 5 (3.60%) SAP
4 4 (2.88%) Adobe
5 3 (2.16%) IBM
6 2 (1.44%) Thales
7 1 (0.72%) CrowdStrike
7 1 (0.72%) Databricks
7 1 (0.72%) Epicor
7 1 (0.72%) JDA
7 1 (0.72%) Salesforce