Business Analysis Jobs with Hybrid/Remote/WFH Options

Business Analysis
UK > Work from Home

The table below provides summary statistics for permanent remote or hybrid work requiring Business Analysis skills. It includes a benchmarking guide to the annual salaries offered in vacancies that cited Business Analysis over the 6 months leading up to 18 May 2025, comparing them to the same period in the previous two years.

6 months to
18 May 2025
Same period 2024 Same period 2023
Rank 237 212 136
Rank change year-on-year -25 -76 +47
Permanent jobs citing Business Analysis 258 527 1,023
As % of all permanent jobs with a WFH option 1.38% 1.56% 2.53%
As % of the Processes & Methodologies category 1.47% 1.71% 2.63%
Number of salaries quoted 152 338 760
10th Percentile £45,000 £36,925 £41,250
25th Percentile £55,000 £43,946 £49,585
Median annual salary (50th Percentile) £70,000 £55,000 £60,000
Median % change year-on-year +27.27% -8.33% +9.09%
75th Percentile £102,500 £66,778 £70,600
90th Percentile £136,250 £87,500 £82,500
UK median annual salary £60,000 £54,000 £60,000
% change year-on-year +11.11% -10.00% +4.35%

All Process and Methodology Skills
Work from Home

Business Analysis falls under the Processes and Methodologies category. For comparison with the information above, the following table provides summary statistics for all permanent job vacancies with remote or hybrid options requiring process or methodology skills.

Permanent vacancies with a requirement for process or methodology skills 17,583 30,859 38,849
As % of all permanent jobs with a WFH option 94.20% 91.22% 96.06%
Number of salaries quoted 9,820 23,373 27,016
10th Percentile £28,500 £33,750 £37,500
25th Percentile £42,500 £42,500 £47,500
Median annual salary (50th Percentile) £60,000 £57,500 £62,500
Median % change year-on-year +4.35% -8.00% +4.17%
75th Percentile £77,500 £75,000 £82,500
90th Percentile £101,250 £95,000 £100,000
UK median annual salary £57,500 £55,000 £61,000
% change year-on-year +4.55% -9.84% +1.67%

Business Analysis
Trend for Jobs with a WFH Option

Job vacancies with remote working options citing Business Analysis as a proportion of all IT jobs advertised.
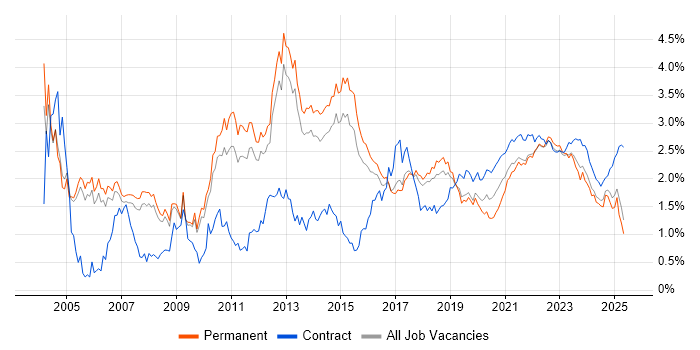
Business Analysis trend for jobs with Hybrid/Remote/WFH options

Business Analysis
Salary Trend for Jobs with a WFH Option

3-month moving average salary quoted in job vacancies with remote working options citing Business Analysis.

Business Analysis salary trend for jobs with a WFH option

Business Analysis
Salary Histogram for Jobs with a WFH Option

Salary distribution for jobs with remote working options citing Business Analysis over the 6 months to 18 May 2025.

Business Analysis salary histogram for jobs with a WFH option

Business Analysis
Co-occurring Skills and Capabilities with WFH Options by Category

The follow tables expand on the table above by listing co-occurrences grouped by category. The same employment type, locality and period is covered with up to 20 co-occurrences shown in each of the following categories:

Application Platforms
1 75 (29.07%) Oracle Application Server
2 14 (5.43%) SharePoint
3 6 (2.33%) CMS
4 5 (1.94%) Confluence
5 2 (0.78%) Apache Spark
6 1 (0.39%) Microsoft Exchange
Applications
1 18 (6.98%) Microsoft Excel
2 5 (1.94%) MS Visio
2 5 (1.94%) Trello
3 4 (1.55%) Microsoft PowerPoint
4 3 (1.16%) Microsoft Office
5 2 (0.78%) Microsoft Project
Business Applications
1 45 (17.44%) Aladdin
2 36 (13.95%) thinkFolio
3 3 (1.16%) Dynamics CRM
4 2 (0.78%) SAP S/4HANA
5 1 (0.39%) Dynamics AX
5 1 (0.39%) SAP ERP
Cloud Services
1 30 (11.63%) Power Platform
2 12 (4.65%) Azure
3 8 (3.10%) Power Automate
4 7 (2.71%) Microsoft 365
4 7 (2.71%) PowerApps
5 6 (2.33%) AWS
5 6 (2.33%) Google Analytics
6 5 (1.94%) Dynamics 365
7 3 (1.16%) Azure Data Factory
8 2 (0.78%) Azure Logic Apps
8 2 (0.78%) Cloud Computing
8 2 (0.78%) SaaS
8 2 (0.78%) WhatsApp
9 1 (0.39%) Azure DevOps
9 1 (0.39%) Lucidchart
9 1 (0.39%) Matillion
9 1 (0.39%) Microsoft Purview
Communications & Networking
1 1 (0.39%) LAN
1 1 (0.39%) WAN
Database & Business Intelligence
1 80 (31.01%) Data Warehouse
2 75 (29.07%) Enterprise Data Warehouse
2 75 (29.07%) Oracle Reports
3 22 (8.53%) Power BI
4 8 (3.10%) Tableau
5 5 (1.94%) SQL Server
6 3 (1.16%) SQL Server Integration Services
6 3 (1.16%) SQL Server Reporting Services
7 2 (0.78%) Big Data
7 2 (0.78%) NoSQL
7 2 (0.78%) RDBMS
7 2 (0.78%) Relational Database
8 1 (0.39%) DB2
8 1 (0.39%) DTS
8 1 (0.39%) KDB
8 1 (0.39%) MS Access
8 1 (0.39%) Oracle Database
8 1 (0.39%) QlikView
Development Applications
1 13 (5.04%) JIRA
2 1 (0.39%) Oracle APEX
General
1 157 (60.85%) Finance
2 129 (50.00%) Social Skills
3 99 (38.37%) Analytical Skills
4 75 (29.07%) Military
4 75 (29.07%) Organisational Skills
5 49 (18.99%) Front Office
6 18 (6.98%) Marketing
7 11 (4.26%) Inclusion and Diversity
7 11 (4.26%) Publishing
7 11 (4.26%) Retail
8 6 (2.33%) Legal
9 5 (1.94%) Law
9 5 (1.94%) Public Sector
10 4 (1.55%) Banking
10 4 (1.55%) Manufacturing
11 3 (1.16%) Documentation Skills
12 2 (0.78%) Back Office
12 2 (0.78%) German Language
12 2 (0.78%) Italian Language
12 2 (0.78%) Presentation Skills
Job Titles
1 118 (45.74%) Analyst
2 106 (41.09%) Business Analyst
3 52 (20.16%) Business Manager
4 49 (18.99%) Fixed Income Business Analyst
5 25 (9.69%) Database Engineer
6 15 (5.81%) Finance Business Analyst
6 15 (5.81%) Financial Analyst
6 15 (5.81%) Senior
7 12 (4.65%) Lead
8 11 (4.26%) Product Owner
9 10 (3.88%) IT Manager
9 10 (3.88%) Senior Analyst
10 9 (3.49%) Business IT Analyst
10 9 (3.49%) IT Analyst
10 9 (3.49%) IT Business Analyst
11 8 (3.10%) Architect
11 8 (3.10%) Senior Business Analyst
12 6 (2.33%) Developer
12 6 (2.33%) Finance Manager
12 6 (2.33%) Project Manager
Libraries, Frameworks & Software Standards
1 6 (2.33%) CSS
1 6 (2.33%) HTML
2 5 (1.94%) .NET
3 3 (1.16%) MACH
4 2 (0.78%) Gherkin
4 2 (0.78%) Pandas
4 2 (0.78%) SPFx
4 2 (0.78%) Swagger
5 1 (0.39%) .NET Framework
5 1 (0.39%) EDI
5 1 (0.39%) FIX Protocol
5 1 (0.39%) GraphQL
5 1 (0.39%) LDAP
5 1 (0.39%) Node.js
5 1 (0.39%) OAuth
5 1 (0.39%) React
Miscellaneous
1 49 (18.99%) Derivative
1 49 (18.99%) Fixed Income
1 49 (18.99%) Hedge funds
2 43 (16.67%) Onboarding
3 18 (6.98%) Product Ownership
4 6 (2.33%) Marketing Technology
5 3 (1.16%) Algorithms
5 3 (1.16%) Data Structures
5 3 (1.16%) PMI
5 3 (1.16%) Reinsurance
5 3 (1.16%) Self-Motivation
6 2 (0.78%) Data Protection Act
6 2 (0.78%) Digital Media
6 2 (0.78%) Management Information System
6 2 (0.78%) Virtual Team
7 1 (0.39%) Driving Licence
7 1 (0.39%) Housing Association
7 1 (0.39%) Low-Code
7 1 (0.39%) PropTech
7 1 (0.39%) Renewable Energy
Operating Systems
1 2 (0.78%) Android
1 2 (0.78%) Apple iOS
2 1 (0.39%) AIX
2 1 (0.39%) Linux
2 1 (0.39%) Unix
Processes & Methodologies
1 180 (69.77%) Agile
2 102 (39.53%) Analytics
3 85 (32.95%) Customer Experience
3 85 (32.95%) Data Modelling
4 83 (32.17%) ITIL
5 80 (31.01%) DevOps
5 80 (31.01%) Service Management
6 79 (30.62%) Data Integration
7 78 (30.23%) Data Management
8 65 (25.19%) Business Intelligence
9 52 (20.16%) Asset Management
10 50 (19.38%) Portfolio Management
11 49 (18.99%) Investment Management
12 43 (16.67%) Data Mapping
13 39 (15.12%) Problem-Solving
14 29 (11.24%) Roadmaps
15 28 (10.85%) Project Management
16 26 (10.08%) SDLC
17 25 (9.69%) Continuous Improvement
17 25 (9.69%) User Stories
Programming Languages
1 60 (23.26%) SQL
2 54 (20.93%) Python
3 8 (3.10%) PowerShell
4 3 (1.16%) Bash
4 3 (1.16%) Data Analysis Expressions
5 2 (0.78%) C#
6 1 (0.39%) ABAP
6 1 (0.39%) Java
6 1 (0.39%) JavaScript
6 1 (0.39%) PHP
6 1 (0.39%) R
6 1 (0.39%) RPG
6 1 (0.39%) RPG IV
Qualifications
1 75 (29.07%) DBS Check
2 51 (19.77%) Degree
3 6 (2.33%) PMI Certification
4 5 (1.94%) CSPO
4 5 (1.94%) Master's Degree
4 5 (1.94%) Microsoft Certification
4 5 (1.94%) TOGAF Certification
5 4 (1.55%) Computer Science Degree
6 3 (1.16%) CBAP
6 3 (1.16%) PMP
6 3 (1.16%) Security Cleared
7 2 (0.78%) PgMP
7 2 (0.78%) SC Cleared
8 1 (0.39%) ACCA
8 1 (0.39%) CFA
8 1 (0.39%) CIMA
8 1 (0.39%) DV Cleared
8 1 (0.39%) IIBA
8 1 (0.39%) Six Sigma Black Belt
8 1 (0.39%) Six Sigma Green Belt
Quality Assurance & Compliance
1 14 (5.43%) QA
2 8 (3.10%) PMO
3 5 (1.94%) GDPR
4 3 (1.16%) Accessibility
5 2 (0.78%) ISO/IEC 27001
6 1 (0.39%) Actionable Recommendations
6 1 (0.39%) HIPAA
6 1 (0.39%) ISO 9001
System Software
1 1 (0.39%) Active Directory
Vendors
1 76 (29.46%) Oracle
2 43 (16.67%) BISAM
3 42 (16.28%) Charles River
4 36 (13.95%) Calypso
4 36 (13.95%) SimCorp
5 33 (12.79%) Microsoft
6 7 (2.71%) Anaplan
7 6 (2.33%) Google
8 4 (1.55%) SAP
9 2 (0.78%) Cognos
9 2 (0.78%) Guidewire
9 2 (0.78%) IBM
9 2 (0.78%) Salesforce
10 1 (0.39%) Atlassian
10 1 (0.39%) ServiceNow
10 1 (0.39%) Workday