Hybrid/Remote Analytics Job Trends

Analytics
UK > Work from Home

The table below provides summary statistics and salary benchmarking for remote or hybrid work requiring Analytics skills. It covers permanent job vacancies from the 6 months leading up to 18 November 2025, with comparisons to the same periods in the previous two years.

6 months to
18 Nov 2025
Same period 2024 Same period 2023
Rank 24 30 25
Rank change year-on-year +6 -5 +5
Permanent jobs citing Analytics 1,120 1,441 1,822
As % of all permanent jobs with remote/hybrid work options 7.38% 7.37% 8.40%
As % of the Processes & Methodologies category 8.05% 8.30% 8.85%
Number of salaries quoted 671 751 1,343
10th Percentile £35,500 £41,250 £40,000
25th Percentile £45,000 £52,500 £51,825
Median annual salary (50th Percentile) £60,000 £70,000 £65,000
Median % change year-on-year -14.29% +7.69% -
75th Percentile £87,500 £92,500 £89,041
90th Percentile £112,500 £115,000 £113,750
UK median annual salary £60,000 £70,000 £65,000
% change year-on-year -14.29% +7.69% -1.37%

All Process and Methodology Skills
Work from Home

Analytics falls under the Processes and Methodologies category. For comparison with the information above, the following table provides summary statistics for all permanent job vacancies with remote or hybrid options requiring process or methodology skills.

Permanent vacancies with a requirement for process or methodology skills 13,910 17,357 20,597
As % of all permanent jobs with a WFH option 91.63% 88.77% 95.01%
Number of salaries quoted 8,713 10,295 16,664
10th Percentile £29,500 £36,250 £36,750
25th Percentile £40,000 £46,250 £46,750
Median annual salary (50th Percentile) £57,500 £62,500 £62,500
Median % change year-on-year -8.00% - -
75th Percentile £77,500 £81,250 £80,813
90th Percentile £98,750 £100,000 £97,500
UK median annual salary £55,000 £60,000 £60,000
% change year-on-year -8.33% - -

Analytics
Job Vacancy Trend for Remote/Hybrid Jobs

Historical trend showing the proportion of permanent IT job postings citing Analytics and offering remote or hybrid work options relative to all permanent IT jobs advertised.
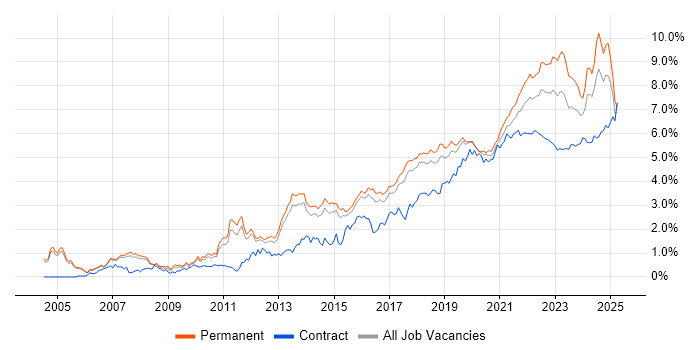
Analytics job vacancy trend for remote/hybrid jobs

Analytics
Salary Trend for Remote/Hybrid Jobs

Salary distribution trend for jobs with remote/hybrid work options citing Analytics.

Salary distribution trend for jobs with remote/hybrid work options citing Analytics

Analytics
Salary Histogram for Remote/Hybrid Jobs

Salary distribution for jobs with remote/hybrid work options citing Analytics over the 6 months to 18 November 2025.

Analytics salary histogram for jobs with remote/hybrid work options

Analytics
Co-Occurring Skills & Capabilities in Remote/Hybrid Jobs by Category

The following tables expand on the one above by listing co-occurrences grouped by category. They cover the same employment type, locality and period, with up to 20 co-occurrences shown in each category:

Application Platforms
1 49 (4.38%) CMS
2 33 (2.95%) WordPress
3 19 (1.70%) SharePoint
4 18 (1.61%) Apache Airflow
5 17 (1.52%) Apache Spark
6 15 (1.34%) Confluence
7 13 (1.16%) Apache
8 11 (0.98%) Oracle SOA Suite
9 10 (0.89%) Headless CMS
10 9 (0.80%) Microsoft Exchange
10 9 (0.80%) SAS
11 8 (0.71%) Drupal
12 3 (0.27%) Umbraco
13 2 (0.18%) Jupyter
14 1 (0.089%) ArcGIS
14 1 (0.089%) DNN
14 1 (0.089%) Oracle Workflow
Applications
1 125 (11.16%) Microsoft Excel
2 54 (4.82%) Microsoft Office
3 24 (2.14%) Adobe XD
4 20 (1.79%) Photoshop
5 15 (1.34%) Microsoft PowerPoint
6 14 (1.25%) InDesign
7 10 (0.89%) Adobe Illustrator
8 8 (0.71%) Adobe Creative Suite
8 8 (0.71%) Spreadsheet
9 7 (0.63%) Microsoft Project
10 5 (0.45%) Adobe Premiere
10 5 (0.45%) Chatbot
10 5 (0.45%) Trello
11 4 (0.36%) SketchUp
12 1 (0.089%) MS Visio
12 1 (0.089%) Notion
12 1 (0.089%) SPSS
Business Applications
1 28 (2.50%) Shopify
2 22 (1.96%) Dynamics CRM
3 20 (1.79%) Oracle ERP
4 16 (1.43%) Dynamics GP
4 16 (1.43%) SAP S/4HANA
5 10 (0.89%) Oracle Assets
5 10 (0.89%) Oracle General Ledger
5 10 (0.89%) Oracle Payables
5 10 (0.89%) Oracle Receivables
6 8 (0.71%) Adaptiv
6 8 (0.71%) Oracle Financials
7 7 (0.63%) Salesforce CRM
8 6 (0.54%) NetSuite
9 5 (0.45%) Magento
10 3 (0.27%) Payment Gateway
10 3 (0.27%) SAP SCM
11 2 (0.18%) ResourceLink
11 2 (0.18%) SAP CO
11 2 (0.18%) SAP ERP
11 2 (0.18%) SAP SD
Cloud Services
1 343 (30.63%) Azure
2 253 (22.59%) Power Platform
3 129 (11.52%) AWS
4 118 (10.54%) Google Analytics
5 95 (8.48%) Snowflake
6 92 (8.21%) SaaS
7 77 (6.88%) Azure Data Factory
8 72 (6.43%) Microsoft 365
9 66 (5.89%) Azure DevOps
10 64 (5.71%) GitHub
11 63 (5.63%) Azure Synapse Analytics
12 61 (5.45%) GCP
13 46 (4.11%) Entra ID
14 41 (3.66%) dbt
15 38 (3.39%) Figma
16 35 (3.13%) Google Ads
17 31 (2.77%) Serverless
18 30 (2.68%) Azure Monitor
18 30 (2.68%) GitHub Copilot
19 26 (2.32%) Google Tag Manager
Communications & Networking
1 17 (1.52%) VPN
2 10 (0.89%) Firewall
2 10 (0.89%) Unified Communications
3 8 (0.71%) Broadband
4 6 (0.54%) DNS
5 5 (0.45%) Network Security
6 4 (0.36%) CHAP
6 4 (0.36%) Wireshark
7 3 (0.27%) Intrusion Detection
7 3 (0.27%) SAN
7 3 (0.27%) WAN
8 2 (0.18%) SD-WAN
9 1 (0.089%) 4G
9 1 (0.089%) 5G
9 1 (0.089%) DAB
9 1 (0.089%) DHCP
9 1 (0.089%) Ethernet
9 1 (0.089%) FTP
9 1 (0.089%) SMS
9 1 (0.089%) TCP/IP
Database & Business Intelligence
1 237 (21.16%) Power BI
2 139 (12.41%) Data Warehouse
3 105 (9.38%) Tableau
4 64 (5.71%) SQL Server
5 59 (5.27%) Data Lake
6 51 (4.55%) Azure SQL Database
7 45 (4.02%) SQL Server Reporting Services
8 38 (3.39%) Metadata
9 24 (2.14%) SQL Server Integration Services
10 22 (1.96%) BigQuery
10 22 (1.96%) Looker
11 18 (1.61%) Amazon Redshift
11 18 (1.61%) Snowflake Schema
12 15 (1.34%) Big Data
13 13 (1.16%) NoSQL
13 13 (1.16%) PostgreSQL
13 13 (1.16%) Power Query
14 11 (0.98%) DynamoDB
15 9 (0.80%) Amazon Athena
15 9 (0.80%) MySQL
Development Applications
1 52 (4.64%) JIRA
2 30 (2.68%) Git
3 21 (1.88%) Axure RP
3 21 (1.88%) Balsamiq
4 19 (1.70%) Jenkins
4 19 (1.70%) Oracle Forms
5 9 (0.80%) ER Studio
6 8 (0.71%) Cypress.io
7 4 (0.36%) Bazaar
7 4 (0.36%) ERwin
7 4 (0.36%) GitLab
7 4 (0.36%) PowerDesigner
7 4 (0.36%) RStudio
8 3 (0.27%) Visual Studio
9 2 (0.18%) SQL Server Management Studio (SSMS)
10 1 (0.089%) JUnit
10 1 (0.089%) Mercurial
10 1 (0.089%) Selenium
10 1 (0.089%) TeamCity
10 1 (0.089%) TestNG
General
1 443 (39.55%) Social Skills
2 397 (35.45%) Finance
3 312 (27.86%) Analytical Skills
4 209 (18.66%) Marketing
5 99 (8.84%) Public Sector
6 88 (7.86%) Inclusion and Diversity
7 74 (6.61%) Retail
8 62 (5.54%) Law
9 61 (5.45%) Presentation Skills
10 58 (5.18%) Manufacturing
11 55 (4.91%) Banking
12 53 (4.73%) Legal
13 39 (3.48%) Organisational Skills
14 24 (2.14%) Advertising
15 23 (2.05%) Back Office
16 21 (1.88%) Financial Institution
17 19 (1.70%) Billing
18 18 (1.61%) Front Office
18 18 (1.61%) Influencing Skills
18 18 (1.61%) Pharmaceutical
Job Titles
1 178 (15.89%) Senior
2 144 (12.86%) Analyst
3 110 (9.82%) Architect
4 89 (7.95%) Developer
5 84 (7.50%) Lead
6 80 (7.14%) Data Engineer
7 56 (5.00%) Data Architect
8 53 (4.73%) Senior Manager
9 51 (4.55%) Data Analyst
10 46 (4.11%) Analytics Manager
11 44 (3.93%) Solutions Architect
12 34 (3.04%) Senior Analytics Manager
13 33 (2.95%) Designer
14 32 (2.86%) Consultant
15 31 (2.77%) Data Manager
16 29 (2.59%) Cloud Engineer
17 27 (2.41%) Business Intelligence Analyst
17 27 (2.41%) Senior Data Engineer
18 26 (2.32%) Marketing Executive
19 25 (2.23%) Senior Developer
Libraries, Frameworks & Software Standards
1 56 (5.00%) HTML
2 43 (3.84%) CSS
3 30 (2.68%) OAuth
3 30 (2.68%) RESTful
4 28 (2.50%) JSON
5 23 (2.05%) Node.js
5 23 (2.05%) OAuth2
6 19 (1.70%) .NET
6 19 (1.70%) React
7 17 (1.52%) Kafka
7 17 (1.52%) PySpark
7 17 (1.52%) SAML
8 16 (1.43%) Pandas
8 16 (1.43%) REST
8 16 (1.43%) XML
9 14 (1.25%) scikit-learn
10 13 (1.16%) AngularJS
11 10 (0.89%) Middleware
12 9 (0.80%) SAP Fiori
12 9 (0.80%) TensorFlow
Miscellaneous
1 82 (7.32%) Self-Motivation
2 70 (6.25%) Cloud Native
3 68 (6.07%) Social Media
4 67 (5.98%) Analytical Mindset
4 67 (5.98%) Product Ownership
5 51 (4.55%) Onboarding
6 39 (3.48%) Management Information System
7 32 (2.86%) Algorithms
8 28 (2.50%) Virtual Team
9 19 (1.70%) Enterprise Software
9 19 (1.70%) Legacy Systems
10 18 (1.61%) Blog
11 17 (1.52%) Web Conferencing
12 15 (1.34%) Credit Risk
13 12 (1.07%) Market Risk
13 12 (1.07%) Reinsurance
14 11 (0.98%) Distributed Systems
14 11 (0.98%) Greenfield Project
14 11 (0.98%) Security Posture
15 10 (0.89%) Data Structures
Operating Systems
1 52 (4.64%) Windows
2 22 (1.96%) Linux
3 19 (1.70%) Windows 10
4 8 (0.71%) Unix
5 4 (0.36%) Android
6 3 (0.27%) Apple iOS
6 3 (0.27%) Windows Server
7 1 (0.089%) VMS
7 1 (0.089%) Windows Server 2019
Processes & Methodologies
1 310 (27.68%) Business Intelligence
2 292 (26.07%) AI
3 286 (25.54%) Decision-Making
4 276 (24.64%) Problem-Solving
5 272 (24.29%) Agile
6 246 (21.96%) Continuous Improvement
7 205 (18.30%) Data Analytics
8 174 (15.54%) Data Modelling
9 166 (14.82%) DevOps
10 149 (13.30%) Machine Learning
11 148 (13.21%) Visualisation
12 147 (13.13%) Roadmaps
13 132 (11.79%) User Experience
14 129 (11.52%) Data Engineering
14 129 (11.52%) Data Management
15 125 (11.16%) Actionable Insight
16 124 (11.07%) ETL
17 123 (10.98%) Project Management
18 120 (10.71%) Mentoring
19 118 (10.54%) CRM
Programming Languages
1 338 (30.18%) SQL
2 262 (23.39%) Python
3 50 (4.46%) PowerShell
4 45 (4.02%) JavaScript
5 43 (3.84%) Java
6 41 (3.66%) Data Analysis Expressions
7 33 (2.95%) R
8 22 (1.96%) Bash
8 22 (1.96%) C#
9 19 (1.70%) Bicep
9 19 (1.70%) T-SQL
10 17 (1.52%) PL/SQL
11 16 (1.43%) Scala
12 15 (1.34%) TypeScript
13 13 (1.16%) C++
14 11 (0.98%) Shell Script
15 8 (0.71%) PHP
16 5 (0.45%) Go
17 4 (0.36%) Fortran
17 4 (0.36%) Kusto Query Language
Qualifications
1 226 (20.18%) Degree
2 86 (7.68%) Security Cleared
3 77 (6.88%) SC Cleared
4 34 (3.04%) Master's Degree
5 26 (2.32%) Computer Science Degree
6 23 (2.05%) DBS Check
6 23 (2.05%) Microsoft Certification
7 21 (1.88%) CISA
8 19 (1.70%) ACCA
8 19 (1.70%) Azure Certification
8 19 (1.70%) CTC Cleared
9 17 (1.52%) CISSP
9 17 (1.52%) PMP
10 16 (1.43%) BPSS Clearance
10 16 (1.43%) ITIL Certification
10 16 (1.43%) Numerate Degree
11 15 (1.34%) CFA
11 15 (1.34%) PMI Certification
12 14 (1.25%) AWS Certification
13 13 (1.16%) CIMA
Quality Assurance & Compliance
1 105 (9.38%) Data Quality
2 97 (8.66%) Accessibility
3 52 (4.64%) GDPR
4 39 (3.48%) ISO/IEC 27001
5 31 (2.77%) WCAG
6 22 (1.96%) SLA
7 19 (1.70%) NIST
7 19 (1.70%) QA
8 15 (1.34%) Actionable Recommendations
9 13 (1.16%) IFRS
10 12 (1.07%) ISO 9001
11 9 (0.80%) COBIT
12 8 (0.71%) Sarbanes-Oxley
13 6 (0.54%) GRC
13 6 (0.54%) PCI DSS
13 6 (0.54%) SOC 2
14 5 (0.45%) ITGC
14 5 (0.45%) PMO
15 3 (0.27%) California Consumer Privacy Act
16 2 (0.18%) PERC
System Software
1 19 (1.70%) Virtual Desktop
2 18 (1.61%) Active Directory
3 16 (1.43%) Docker
3 16 (1.43%) Virtual Machines
4 7 (0.63%) Hyper-V
4 7 (0.63%) VMware Infrastructure
5 2 (0.18%) Firmware
6 1 (0.089%) Slurm Workload Manager
Systems Management
1 82 (7.32%) Terraform
2 21 (1.88%) Kubernetes
3 19 (1.70%) Microsoft Intune
4 18 (1.61%) Single Sign-On
5 8 (0.71%) SCCM
6 6 (0.54%) Ansible
6 6 (0.54%) Prometheus
7 5 (0.45%) Grafana
7 5 (0.45%) QRadar
7 5 (0.45%) SCOM
8 2 (0.18%) Argo
8 2 (0.18%) Failover Clustering
9 1 (0.089%) AppManager
9 1 (0.089%) Computer Emergency Response Teams
9 1 (0.089%) Computer Incident Response Team
9 1 (0.089%) Ganglia
9 1 (0.089%) ITRS Geneos
9 1 (0.089%) RSA Archer
9 1 (0.089%) SmoothWall
Vendors
1 251 (22.41%) Microsoft
2 168 (15.00%) Google
3 78 (6.96%) Databricks
4 55 (4.91%) Salesforce
5 51 (4.55%) Adobe
6 42 (3.75%) Oracle
7 41 (3.66%) SAP
8 33 (2.95%) Cisco
9 22 (1.96%) HubSpot
10 19 (1.70%) Apple
11 14 (1.25%) Murex
11 14 (1.25%) Sage
12 13 (1.16%) Zoho
13 12 (1.07%) Alteryx
14 11 (0.98%) Autodesk
15 10 (0.89%) Ahrefs
15 10 (0.89%) ServiceNow
16 9 (0.80%) Informatica
16 9 (0.80%) Instagram
16 9 (0.80%) Talend