Microsoft Excel Jobs with Work from Home Options

Microsoft Excel
UK > Work from Home

The table below provides summary statistics for permanent remote or hybrid work requiring Microsoft Excel skills. It includes a benchmarking guide to the annual salaries offered in vacancies that cited Microsoft Excel over the 6 months leading up to 26 July 2024, comparing them to the same period in the previous two years.

6 months to
26 Jul 2024
Same period 2023 Same period 2022
Rank 56 97 148
Rank change year-on-year +41 +51 +35
Permanent jobs citing Microsoft Excel 1,253 1,050 2,185
As % of all permanent jobs with a WFH option 4.49% 3.20% 2.78%
As % of the Applications category 52.60% 43.79% 36.22%
Number of salaries quoted 466 782 1,228
10th Percentile £26,000 £30,431 £28,000
25th Percentile £30,375 £30,500 £34,613
Median annual salary (50th Percentile) £43,865 £42,500 £47,500
Median % change year-on-year +3.21% -10.53% +11.76%
75th Percentile £57,500 £57,729 £61,250
90th Percentile £67,500 £69,875 £75,000
UK median annual salary £42,500 £42,500 £47,000
% change year-on-year - -9.57% +10.59%

All Software Application Skills
Work from Home

Microsoft Excel falls under the Software Applications category. For comparison with the information above, the following table provides summary statistics for all permanent job vacancies with remote or hybrid options requiring software application skills.

Permanent vacancies with a requirement for software application skills 2,382 2,398 6,033
As % of all permanent jobs with a WFH option 8.53% 7.31% 7.68%
Number of salaries quoted 1,328 1,817 2,936
10th Percentile £26,250 £30,000 £27,589
25th Percentile £31,250 £33,500 £33,750
Median annual salary (50th Percentile) £45,000 £50,000 £46,750
Median % change year-on-year -10.00% +6.95% +3.89%
75th Percentile £61,250 £65,000 £62,063
90th Percentile £72,650 £77,500 £76,250
UK median annual salary £40,500 £44,494 £45,000
% change year-on-year -8.98% -1.12% -

Microsoft Excel
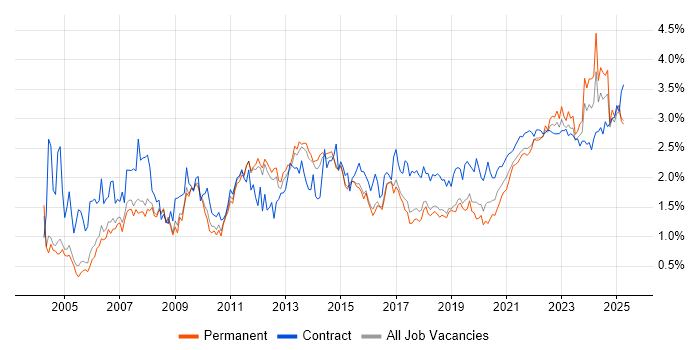
Trend for Jobs with a WFH Option

Job vacancies with a work from home option citing Microsoft Excel as a proportion of all IT jobs advertised.

Microsoft Excel trend for jobs with a WFH option

Microsoft Excel
Salary Trend for Jobs with a WFH Option

3-month moving average salary quoted in job vacancies with a work from home option citing Microsoft Excel.

Microsoft Excel salary trend for jobs with a WFH option

Microsoft Excel
Salary Histogram for Jobs with a WFH Option

Salary distribution for jobs with a work from home option citing Microsoft Excel over the 6 months to 26 July 2024.

Microsoft Excel salary histogram for jobs with a WFH option

Microsoft Excel
Co-occurring Skills and Capabilities with WFH Options by Category

The follow tables expand on the table above by listing co-occurrences grouped by category. The same employment type, locality and period is covered with up to 20 co-occurrences shown in each of the following categories:

Application Platforms
1 34 (2.71%) SharePoint
2 9 (0.72%) Confluence
3 8 (0.64%) SAS
4 5 (0.40%) Apache Spark
5 4 (0.32%) Apache
5 4 (0.32%) Apache Airflow
5 4 (0.32%) CMS
6 3 (0.24%) GlassFish
6 3 (0.24%) JBoss
6 3 (0.24%) Tomcat
7 1 (0.080%) IBM Domino
7 1 (0.080%) IIS
7 1 (0.080%) Jupyter
7 1 (0.080%) Microsoft Exchange
7 1 (0.080%) TPMS
Applications
1 201 (16.04%) Microsoft Office
2 187 (14.92%) Microsoft PowerPoint
3 79 (6.30%) Microsoft Project
4 29 (2.31%) MS Visio
5 24 (1.92%) Spreadsheet
6 9 (0.72%) SPSS
7 5 (0.40%) AutoCAD
8 3 (0.24%) Adobe Captivate
8 3 (0.24%) InDesign
8 3 (0.24%) Photoshop
9 2 (0.16%) Adobe Premiere
9 2 (0.16%) Fireworks
10 1 (0.080%) Adobe Creative Suite
10 1 (0.080%) Adobe Illustrator
10 1 (0.080%) UserZoom
Business Applications
1 55 (4.39%) Primavera
2 6 (0.48%) iTrent
2 6 (0.48%) SAP Business One
3 4 (0.32%) Elite 3E
3 4 (0.32%) NEC Housing
3 4 (0.32%) Oracle ERP
3 4 (0.32%) Relativity
4 3 (0.24%) SAP Travel Management
5 2 (0.16%) Dynamics CRM
5 2 (0.16%) Oracle EBS
5 2 (0.16%) Oracle Financials
5 2 (0.16%) Oracle Receivables
5 2 (0.16%) Sparx Enterprise Architect
5 2 (0.16%) Visualfiles
6 1 (0.080%) Dynamics NAV
6 1 (0.080%) Lorenzo
6 1 (0.080%) NetSuite
6 1 (0.080%) SAP MDG
6 1 (0.080%) SAP S/4HANA
6 1 (0.080%) Unit4 Business World
Cloud Services
1 189 (15.08%) Power Platform
2 65 (5.19%) Azure
3 38 (3.03%) Microsoft 365
4 29 (2.31%) AWS
5 21 (1.68%) SaaS
6 15 (1.20%) Azure Data Factory
7 14 (1.12%) Azure DevOps
7 14 (1.12%) Power Automate
8 13 (1.04%) PowerApps
9 11 (0.88%) Google Sheets
10 10 (0.80%) Snowflake
11 9 (0.72%) Google Ads
11 9 (0.72%) Google Analytics
12 8 (0.64%) Facebook Ads
13 6 (0.48%) Adobe Analytics
13 6 (0.48%) Smartsheet
13 6 (0.48%) Veeva
14 5 (0.40%) Azure Synapse Analytics
14 5 (0.40%) Google Workspace
14 5 (0.40%) Microsoft Purview
Communications & Networking
1 466 (37.19%) Broadband
2 10 (0.80%) Internet
3 8 (0.64%) LAN
3 8 (0.64%) WAN
4 7 (0.56%) Wireless
5 5 (0.40%) DNS
6 4 (0.32%) Firewall
6 4 (0.32%) Intranet
7 3 (0.24%) DHCP
7 3 (0.24%) Radio Access Network
7 3 (0.24%) Reverse Proxy
7 3 (0.24%) TCP/IP
8 2 (0.16%) Network Security
8 2 (0.16%) Skype
8 2 (0.16%) VPN
8 2 (0.16%) WebEx
8 2 (0.16%) WPA
9 1 (0.080%) Cisco IPT
9 1 (0.080%) SAN
9 1 (0.080%) Wi-Fi
Database & Business Intelligence
1 188 (15.00%) Power BI
2 49 (3.91%) Tableau
3 45 (3.59%) SQL Server
4 31 (2.47%) Data Warehouse
5 22 (1.76%) SQL Server Reporting Services
6 19 (1.52%) Power Query
7 17 (1.36%) MS Access
7 17 (1.36%) QlikView
8 13 (1.04%) SQL Server Integration Services
9 10 (0.80%) Amazon QuickSight
9 10 (0.80%) Azure SQL Data Warehouse
9 10 (0.80%) Relational Database
10 9 (0.72%) Data Lake
11 8 (0.64%) GIS
12 7 (0.56%) Big Data
12 7 (0.56%) Data Mining
12 7 (0.56%) Geospatial Data
12 7 (0.56%) MySQL
12 7 (0.56%) PostgreSQL
13 6 (0.48%) PowerPivot
Development Applications
1 26 (2.08%) JIRA
2 8 (0.64%) Git
3 7 (0.56%) Visual Studio
4 4 (0.32%) Mercurial
5 2 (0.16%) Balsamiq
5 2 (0.16%) Katalon Studio
5 2 (0.16%) Postman
5 2 (0.16%) SQL Server Management Studio (SSMS)
5 2 (0.16%) Team Foundation Server
General
1 845 (67.44%) Social Skills
2 716 (57.14%) Finance
3 650 (51.88%) Analytical Skills
4 457 (36.47%) Influencing Skills
5 90 (7.18%) Marketing
6 88 (7.02%) Inclusion and Diversity
7 84 (6.70%) Legal
8 76 (6.07%) Organisational Skills
9 52 (4.15%) Presentation Skills
10 50 (3.99%) Retail
11 41 (3.27%) Law
12 30 (2.39%) Public Sector
13 23 (1.84%) Pharmaceutical
14 21 (1.68%) Advertising
15 16 (1.28%) Aerospace
15 16 (1.28%) Manufacturing
16 15 (1.20%) Local Government
17 14 (1.12%) General Ledger
18 13 (1.04%) German Language
19 11 (0.88%) Telecoms
Job Titles
1 739 (58.98%) Analyst
2 339 (27.06%) Senior
3 285 (22.75%) Senior Analyst
4 170 (13.57%) Financial Analyst
5 123 (9.82%) Commercial Analyst
6 81 (6.46%) Data Analyst
7 59 (4.71%) Coordinator
8 52 (4.15%) Project Controller
9 35 (2.79%) Developer
10 27 (2.15%) Administrator
11 26 (2.08%) Senior Technician
12 25 (2.00%) Lead
12 25 (2.00%) Project Manager
13 23 (1.84%) Systems Analyst
14 22 (1.76%) Consultant
14 22 (1.76%) Data Technician
15 20 (1.60%) Senior Financial Analyst
16 19 (1.52%) Business Analyst
17 18 (1.44%) Support Analyst
18 15 (1.20%) Business Intelligence Developer
Libraries, Frameworks & Software Standards
1 18 (1.44%) HTML
2 12 (0.96%) CSS
3 11 (0.88%) .NET
4 9 (0.72%) XML
5 6 (0.48%) BREW
6 5 (0.40%) .NET Framework
6 5 (0.40%) PySpark
7 4 (0.32%) JSON
7 4 (0.32%) Oracle Fusion
8 3 (0.24%) jQuery
8 3 (0.24%) LDAP
8 3 (0.24%) RESTful
8 3 (0.24%) SAML
8 3 (0.24%) SAP TM
9 2 (0.16%) EDI
9 2 (0.16%) Gherkin
9 2 (0.16%) GraphQL
9 2 (0.16%) ODBC
9 2 (0.16%) Web Services
9 2 (0.16%) XSLT
Miscellaneous
1 88 (7.02%) Self-Motivation
2 67 (5.35%) Management Information System
3 39 (3.11%) Social Media
4 27 (2.15%) Onboarding
5 25 (2.00%) Analytical Mindset
6 17 (1.36%) Foreign Exchange (FX)
7 16 (1.28%) Product Ownership
8 14 (1.12%) Data Structures
9 11 (0.88%) Data Centre
10 10 (0.80%) Driving Licence
11 9 (0.72%) Enterprise Software
11 9 (0.72%) Life Science
11 9 (0.72%) PMI
12 7 (0.56%) NHS
13 5 (0.40%) Algorithms
13 5 (0.40%) Digital Media
13 5 (0.40%) Legacy Systems
14 4 (0.32%) Low-Code
14 4 (0.32%) Renewable Energy
14 4 (0.32%) Virtual Team
Operating Systems
1 61 (4.87%) Windows
2 24 (1.92%) Windows Server
3 17 (1.36%) Windows Vista
4 16 (1.28%) Linux
5 7 (0.56%) Mac OS
6 5 (0.40%) Unix
7 3 (0.24%) AIX
7 3 (0.24%) Solaris
8 2 (0.16%) Windows 10
9 1 (0.080%) Android
9 1 (0.080%) Apple iOS
Processes & Methodologies
1 560 (44.69%) Agile
2 535 (42.70%) Decision-Making
3 485 (38.71%) Actionable Insight
4 484 (38.63%) Mentoring
5 462 (36.87%) Budgeting
6 454 (36.23%) Business Case
7 450 (35.91%) Budgeting and Forecasting
8 216 (17.24%) Business Intelligence
9 199 (15.88%) Problem-Solving
10 129 (10.30%) Data Analysis
11 90 (7.18%) Project Management
12 79 (6.30%) Continuous Improvement
13 76 (6.07%) Customer Service
14 75 (5.99%) Analytics
14 75 (5.99%) Time Management
15 74 (5.91%) Risk Management
16 64 (5.11%) Programme Management
17 60 (4.79%) Performance Management
18 59 (4.71%) Data Management
19 56 (4.47%) Line Management
Programming Languages
1 208 (16.60%) SQL
2 52 (4.15%) Python
3 48 (3.83%) VBA
4 24 (1.92%) T-SQL
5 22 (1.76%) R
6 19 (1.52%) C#
7 18 (1.44%) Data Analysis Expressions
8 16 (1.28%) JavaScript
9 12 (0.96%) PowerShell
10 6 (0.48%) MATLAB
11 4 (0.32%) Apex Code
11 4 (0.32%) Bash
11 4 (0.32%) VB
11 4 (0.32%) VB.NET
12 3 (0.24%) Java
12 3 (0.24%) PL/SQL
12 3 (0.24%) Scala
13 2 (0.16%) Groovy
13 2 (0.16%) Julia
14 1 (0.080%) Formula Language
Qualifications
1 484 (38.63%) ACCA
2 481 (38.39%) CIMA
3 218 (17.40%) Degree
4 65 (5.19%) DBS Check
5 23 (1.84%) Security Cleared
6 15 (1.20%) MRICS
6 15 (1.20%) PMI Certification
7 13 (1.04%) SC Cleared
8 9 (0.72%) PRINCE2 Practitioner
9 7 (0.56%) Computer Science Degree
9 7 (0.56%) ITIL Certification
10 6 (0.48%) PMP
11 5 (0.40%) CFA
11 5 (0.40%) Master's Degree
12 4 (0.32%) ISEB
12 4 (0.32%) Numerate Degree
12 4 (0.32%) PRINCE2 Certification
13 3 (0.24%) BPSS Clearance
13 3 (0.24%) CIPD
13 3 (0.24%) DV Cleared
Quality Assurance & Compliance
1 43 (3.43%) Data Quality
2 26 (2.08%) PMO
3 25 (2.00%) QA
4 17 (1.36%) SLA
5 16 (1.28%) GDPR
6 7 (0.56%) Accessibility
7 5 (0.40%) COBIT
7 5 (0.40%) HIPAA
7 5 (0.40%) ISO 9001
8 4 (0.32%) IFRS
8 4 (0.32%) PCI DSS
8 4 (0.32%) Sarbanes-Oxley
9 3 (0.24%) ISO/IEC 27001
10 2 (0.16%) COSHH
10 2 (0.16%) ISO 14001
10 2 (0.16%) ISO/IEC 15288
10 2 (0.16%) P3O
11 1 (0.080%) GAAP
11 1 (0.080%) GxP
11 1 (0.080%) NIST
System Software
1 20 (1.60%) Active Directory
2 7 (0.56%) VMware Infrastructure
3 3 (0.24%) Hyper-V
4 2 (0.16%) VMware Server
5 1 (0.080%) pfSense
5 1 (0.080%) Terminal Server
5 1 (0.080%) Virtual Desktop
Systems Management
1 4 (0.32%) Ansible
1 4 (0.32%) Progress Chef
1 4 (0.32%) Puppet
2 3 (0.24%) Oracle Statspack
2 3 (0.24%) Single Sign-On
3 1 (0.080%) Active Directory Federation Services
3 1 (0.080%) DatAdvantage
3 1 (0.080%) Failover Clustering
3 1 (0.080%) Kubernetes
3 1 (0.080%) Microsoft Intune
3 1 (0.080%) QRadar
3 1 (0.080%) SCCM
3 1 (0.080%) Stealthwatch
3 1 (0.080%) Symantec Endpoint Protection
3 1 (0.080%) Terraform
3 1 (0.080%) vCenter Server
3 1 (0.080%) WSUS
Vendors
1 881 (70.31%) Microsoft
2 73 (5.83%) SAP
3 43 (3.43%) Google
4 24 (1.92%) Oracle
5 12 (0.96%) Databricks
6 11 (0.88%) Adobe
6 11 (0.88%) CA
7 10 (0.80%) Alteryx
7 10 (0.80%) IBM
8 9 (0.72%) Facebook
8 9 (0.72%) VMware
9 8 (0.64%) Informatica
9 8 (0.64%) Palo Alto
9 8 (0.64%) Qualys
9 8 (0.64%) Salesforce
10 7 (0.56%) Jitterbit
11 6 (0.48%) Cognos
11 6 (0.48%) ServiceNow
11 6 (0.48%) Talend
12 5 (0.40%) Aderant