R Jobs with Hybrid/Remote/WFH Options

R
UK > Work from Home

The table below provides summary statistics for permanent remote or hybrid work requiring R skills. It includes a benchmarking guide to the annual salaries offered in vacancies that cited R over the 6 months leading up to 16 June 2025, comparing them to the same period in the previous two years.

6 months to
16 Jun 2025
Same period 2024 Same period 2023
Rank 323 374 215
Rank change year-on-year +51 -159 +54
Permanent jobs citing R 147 240 608
As % of all permanent jobs with a WFH option 0.75% 0.67% 1.64%
As % of the Programming Languages category 2.07% 1.67% 3.44%
Number of salaries quoted 51 171 238
10th Percentile £40,000 £39,573 £37,500
25th Percentile £51,250 £46,250 £48,000
Median annual salary (50th Percentile) £65,000 £60,000 £63,750
Median % change year-on-year +8.33% -5.88% +6.25%
75th Percentile £77,500 £112,500 £112,500
90th Percentile £80,000 £146,250 £150,000
UK median annual salary £62,000 £60,000 £62,500
% change year-on-year +3.33% -4.00% +4.17%

All Programming Languages
Work from Home

R falls under the Programming Languages category. For comparison with the information above, the following table provides summary statistics for all permanent job vacancies with remote or hybrid options requiring coding skills.

Permanent vacancies with a requirement for coding skills 7,093 14,360 17,680
As % of all permanent jobs with a WFH option 36.36% 40.25% 47.72%
Number of salaries quoted 4,430 11,599 13,646
10th Percentile £39,613 £38,551 £41,227
25th Percentile £47,683 £46,250 £50,000
Median annual salary (50th Percentile) £62,500 £60,000 £65,000
Median % change year-on-year +4.17% -7.69% +4.00%
75th Percentile £83,750 £80,000 £85,000
90th Percentile £113,750 £101,250 £105,000
UK median annual salary £60,000 £60,000 £65,000
% change year-on-year - -7.69% +4.00%

R
Trend for Jobs with a WFH Option

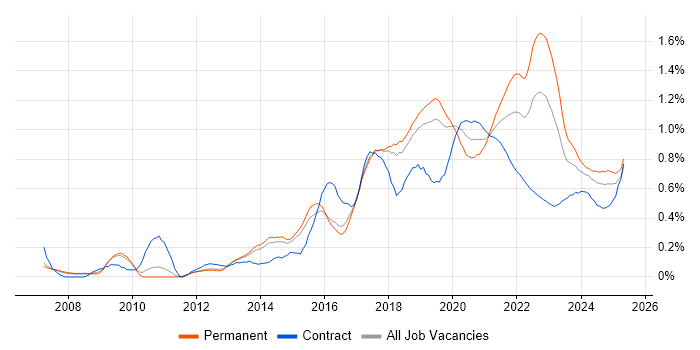
Job vacancies with remote working options citing R as a proportion of all IT jobs advertised.

R trend for jobs with Hybrid/Remote/WFH options

R
Salary Trend for Jobs with a WFH Option

3-month moving average salary quoted in job vacancies with remote working options citing R.

R salary trend for jobs with a WFH option

R
Salary Histogram for Jobs with a WFH Option

Salary distribution for jobs with remote working options citing R over the 6 months to 16 June 2025.

R salary histogram for jobs with a WFH option

R
Co-occurring Skills and Capabilities with WFH Options by Category

The follow tables expand on the table above by listing co-occurrences grouped by category. The same employment type, locality and period is covered with up to 20 co-occurrences shown in each of the following categories:

Application Platforms
1 16 (10.88%) SAS
2 3 (2.04%) ArcGIS
2 3 (2.04%) nginx
3 1 (0.68%) Apache Airflow
3 1 (0.68%) Apache Spark
3 1 (0.68%) SharePoint
Applications
1 8 (5.44%) Microsoft Excel
2 6 (4.08%) Spreadsheet
3 4 (2.72%) Microsoft PowerPoint
3 4 (2.72%) Stata
4 3 (2.04%) AutoCAD
4 3 (2.04%) Blender
4 3 (2.04%) ProjectWise
4 3 (2.04%) Revit
5 1 (0.68%) SPSS
Cloud Services
1 29 (19.73%) Azure
2 27 (18.37%) Power Platform
3 16 (10.88%) AWS
4 9 (6.12%) GCP
4 9 (6.12%) GitHub
5 5 (3.40%) Azure Data Factory
5 5 (3.40%) Azure Synapse Analytics
6 4 (2.72%) Adobe Analytics
6 4 (2.72%) AWS Lambda
6 4 (2.72%) Serverless
7 3 (2.04%) Amazon EC2
7 3 (2.04%) Azure Machine Learning
7 3 (2.04%) npm
8 2 (1.36%) Azure DevOps
8 2 (1.36%) Entra ID
8 2 (1.36%) Snowflake
9 1 (0.68%) ChatGPT
9 1 (0.68%) dbt
9 1 (0.68%) GitHub Copilot
9 1 (0.68%) Power Automate
Communications & Networking
1 4 (2.72%) IPv4
2 2 (1.36%) OSPF
2 2 (1.36%) VLAN
2 2 (1.36%) VPN
3 1 (0.68%) Internet
Database & Business Intelligence
1 27 (18.37%) Power BI
2 18 (12.24%) Data Lake
3 15 (10.20%) Tableau
4 14 (9.52%) Data Warehouse
5 8 (5.44%) Azure SQL Data Warehouse
6 5 (3.40%) NoSQL
6 5 (3.40%) Power Query
7 4 (2.72%) GIS
7 4 (2.72%) Metadata
7 4 (2.72%) PowerPivot
7 4 (2.72%) Qlik Sense
7 4 (2.72%) SQL Server
8 3 (2.04%) BigQuery
8 3 (2.04%) QGIS
9 2 (1.36%) Big Data
9 2 (1.36%) BusinessObjects
9 2 (1.36%) Hadoop
9 2 (1.36%) Oracle Database
9 2 (1.36%) Relational Database
9 2 (1.36%) SQL Server Integration Services
Development Applications
1 10 (6.80%) Git
2 4 (2.72%) Subversion
3 3 (2.04%) Babel
3 3 (2.04%) gulp
3 3 (2.04%) webpack
4 2 (1.36%) ER Studio
5 1 (0.68%) JIRA
5 1 (0.68%) MLflow
5 1 (0.68%) RStudio
General
1 38 (25.85%) Social Skills
2 35 (23.81%) Analytical Skills
3 23 (15.65%) Finance
4 17 (11.56%) Retail
5 11 (7.48%) Inclusion and Diversity
6 9 (6.12%) Telecoms
7 8 (5.44%) Banking
8 7 (4.76%) Marketing
8 7 (4.76%) Public Sector
9 5 (3.40%) Influencing Skills
10 4 (2.72%) Games
10 4 (2.72%) Pharmaceutical
11 3 (2.04%) Fire and Rescue
11 3 (2.04%) Police
12 2 (1.36%) Investment Banking
13 1 (0.68%) Automotive
13 1 (0.68%) Legal
13 1 (0.68%) Local Government
13 1 (0.68%) Manufacturing
13 1 (0.68%) Social Housing
Job Titles
1 27 (18.37%) Senior
2 19 (12.93%) Analyst
3 15 (10.20%) Data Engineer
3 15 (10.20%) Data Scientist
4 8 (5.44%) Analytics Manager
4 8 (5.44%) Azure Data Engineer
4 8 (5.44%) Azure Engineer
4 8 (5.44%) Lead
5 7 (4.76%) Data Analyst
5 7 (4.76%) Programmer
5 7 (4.76%) Senior Analyst
6 6 (4.08%) Architect
6 6 (4.08%) Senior Data Engineer
6 6 (4.08%) Senior Data Scientist
6 6 (4.08%) Solutions Architect
7 5 (3.40%) Developer
8 4 (2.72%) Data Manager
8 4 (2.72%) Lead Architect
8 4 (2.72%) Lead Solutions Architect
8 4 (2.72%) SAS Programmer
Libraries, Frameworks & Software Standards
1 52 (35.37%) HTML
2 3 (2.04%) CSS
2 3 (2.04%) Leaflet
2 3 (2.04%) Node.js
2 3 (2.04%) OAuth
2 3 (2.04%) PostGIS
2 3 (2.04%) React
2 3 (2.04%) REST
2 3 (2.04%) Sass
2 3 (2.04%) Svelte
2 3 (2.04%) Vue
3 2 (1.36%) .NET
3 2 (1.36%) JSON
3 2 (1.36%) PySpark
3 2 (1.36%) PyTorch
3 2 (1.36%) scikit-learn
3 2 (1.36%) TensorFlow
3 2 (1.36%) XML
4 1 (0.68%) Django
4 1 (0.68%) EDI
Miscellaneous
1 14 (9.52%) Management Information System
2 8 (5.44%) Biopharmaceutical
3 6 (4.08%) Credit Risk
3 6 (4.08%) Hybrid Cloud
3 6 (4.08%) Product Ownership
4 5 (3.40%) Market Risk
5 4 (2.72%) Algorithms
5 4 (2.72%) Data Structures
5 4 (2.72%) Distributed Systems
5 4 (2.72%) Legacy Systems
5 4 (2.72%) Public Cloud
6 3 (2.04%) IoT
6 3 (2.04%) NHS
6 3 (2.04%) Smart City
7 1 (0.68%) Analytical Mindset
7 1 (0.68%) Blog
7 1 (0.68%) Distributed Computing
7 1 (0.68%) Freedom of Information
7 1 (0.68%) Greenfield Project
7 1 (0.68%) Onboarding
Operating Systems
1 12 (8.16%) Linux
2 8 (5.44%) Windows
3 3 (2.04%) Ubuntu
Processes & Methodologies
1 65 (44.22%) Machine Learning
2 64 (43.54%) Computer Science
3 59 (40.14%) Artificial Intelligence
4 55 (37.41%) Data Privacy
5 39 (26.53%) Analytics
6 37 (25.17%) Data Science
7 29 (19.73%) Business Intelligence
8 26 (17.69%) Visualisation
9 22 (14.97%) Problem-Solving
9 22 (14.97%) Statistics
10 21 (14.29%) Data Visualisation
10 21 (14.29%) Mentoring
11 18 (12.24%) Data Analysis
11 18 (12.24%) DevOps
11 18 (12.24%) Mathematics
12 17 (11.56%) Data Pipeline
13 15 (10.20%) Data Management
14 14 (9.52%) Data Analytics
14 14 (9.52%) ETL
15 13 (8.84%) Statistical Analysis
Programming Languages
1 127 (86.39%) Python
2 96 (65.31%) SQL
3 55 (37.41%) C#
3 55 (37.41%) MATLAB
4 53 (36.05%) C++
4 53 (36.05%) JavaScript
5 51 (34.69%) TypeScript
6 50 (34.01%) Java
6 50 (34.01%) PHP
7 49 (33.33%) C
7 49 (33.33%) Dart
7 49 (33.33%) Ruby
7 49 (33.33%) Rust
8 8 (5.44%) PowerShell
9 6 (4.08%) Bash
10 5 (3.40%) Julia
10 5 (3.40%) VBA
11 2 (1.36%) Perl
12 1 (0.68%) Fortran
12 1 (0.68%) VB
Qualifications
1 85 (57.82%) Degree
2 51 (34.69%) Computer Science Degree
3 8 (5.44%) Numerate Degree
4 6 (4.08%) Master's Degree
4 6 (4.08%) Security Cleared
5 4 (2.72%) AWS Certification
5 4 (2.72%) DBS Check
5 4 (2.72%) PhD
5 4 (2.72%) Postgraduate
6 3 (2.04%) SC Cleared
7 2 (1.36%) Microsoft Certification
Quality Assurance & Compliance
1 7 (4.76%) GDPR
2 6 (4.08%) Data Quality
3 5 (3.40%) IFRS
3 5 (3.40%) IFRS 9
4 4 (2.72%) Basel II
4 4 (2.72%) Basel III
4 4 (2.72%) Dodd-Frank
4 4 (2.72%) PCI DSS
5 3 (2.04%) CDISC
6 2 (1.36%) Actionable Recommendations
7 1 (0.68%) Accessibility
7 1 (0.68%) QA
System Software
1 2 (1.36%) Docker
Systems Management
1 4 (2.72%) Ansible
1 4 (2.72%) Puppet
2 1 (0.68%) Terraform
Vendors
1 18 (12.24%) Databricks
2 7 (4.76%) Microsoft
3 5 (3.40%) Oracle
4 4 (2.72%) Adobe
4 4 (2.72%) TikTok
5 3 (2.04%) Autodesk
5 3 (2.04%) Google
6 2 (1.36%) Salesforce
7 1 (0.68%) Alteryx
7 1 (0.68%) Remedy
7 1 (0.68%) SAP
7 1 (0.68%) Vertica