Kanban Contract Job Trends in the City of London

Kanban
Central London > City of London

The table below provides summary statistics and contractor rates for jobs advertised in the City of London requiring Kanban skills. It covers contract job vacancies from the 6 months leading up to 6 November 2025, with comparisons to the same periods in the previous two years.

6 months to
6 Nov 2025
Same period 2024 Same period 2023
Rank 83 93 124
Rank change year-on-year +10 +31 -45
Contract jobs citing Kanban 38 32 26
As % of all contract jobs in the City of London 2.21% 1.52% 0.94%
As % of the Processes & Methodologies category 2.35% 1.66% 1.05%
Number of daily rates quoted 22 22 17
10th Percentile £418 £501 £420
25th Percentile £514 £527 £495
Median daily rate (50th Percentile) £625 £588 £550
Median % change year-on-year +6.38% +6.82% -4.35%
75th Percentile £703 £703 £619
90th Percentile £886 £796 £720
Central London median daily rate £625 £588 £538
% change year-on-year +6.38% +9.30% -3.15%

All Process and Methodology Skills
City of London

Kanban falls under the Processes and Methodologies category. For comparison with the information above, the following table provides summary statistics for all contract job vacancies requiring process or methodology skills in the City of London.

Contract vacancies with a requirement for process or methodology skills 1,617 1,933 2,486
As % of all contract IT jobs advertised in the City of London 93.96% 91.65% 89.68%
Number of daily rates quoted 1,123 1,187 1,740
10th Percentile £329 £375 £363
25th Percentile £419 £464 £463
Median daily rate (50th Percentile) £550 £575 £583
Median % change year-on-year -4.35% -1.37% +1.39%
75th Percentile £675 £688 £695
90th Percentile £758 £783 £800
Central London median daily rate £550 £575 £575
% change year-on-year -4.35% - -
Number of hourly rates quoted 19 17 16
10th Percentile £16.96 £16.70 £15.63
25th Percentile £20.18 £23.13 £17.00
Median hourly rate £27.50 £42.50 £32.75
Median % change year-on-year -35.29% +29.77% -30.13%
75th Percentile £41.75 £112.00 £52.63
90th Percentile £63.75 £137.50 £71.25
Central London median hourly rate £27.50 £35.00 £32.75
% change year-on-year -21.43% +6.87% -24.26%

Kanban
Job Vacancy Trend in the City of London

Historical trend showing the proportion of contract IT job postings citing Kanban relative to all contract IT jobs advertised in the City of London.
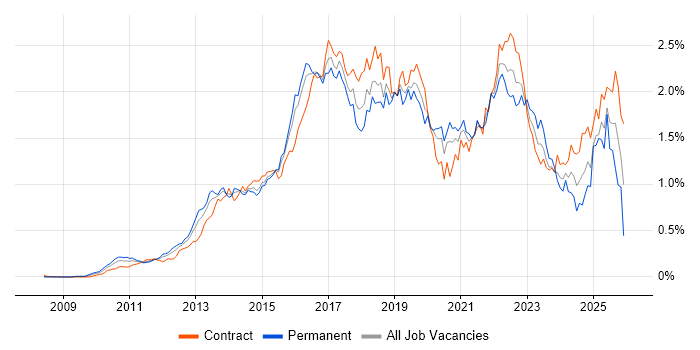
Kanban job vacancy trend in the City of London

Kanban
Daily Rate Trend in the City of London

Contractor daily rate distribution trend for jobs in the City of London citing Kanban.

Contractor daily rate distribution trend for jobs in the City of London citing Kanban

Kanban
Daily Rate Histogram in the City of London

Daily rate distribution for jobs citing Kanban in the City of London over the 6 months to 6 November 2025.

Daily rate histogram for Kanban in the City of London

Kanban
Co-Occurring Skills & Capabilities in the City of London by Category

The following tables expand on the one above by listing co-occurrences grouped by category. They cover the same employment type, locality and period, with up to 20 co-occurrences shown in each category:

Application Platforms
1 2 (5.26%) Confluence
Applications
1 1 (2.63%) Microsoft Office
1 1 (2.63%) Microsoft Project
Cloud Services
1 7 (18.42%) GitHub
2 3 (7.89%) Azure
2 3 (7.89%) Snowflake
3 2 (5.26%) Azure DevOps
3 2 (5.26%) Power Platform
4 1 (2.63%) Azure AI
4 1 (2.63%) Azure Cognitive Services
4 1 (2.63%) Azure Machine Learning
4 1 (2.63%) Miro
4 1 (2.63%) Power Automate
4 1 (2.63%) PowerApps
4 1 (2.63%) SaaS
4 1 (2.63%) Salesforce Sales Cloud
4 1 (2.63%) Salesforce Service Cloud
Communications & Networking
1 2 (5.26%) tcpdump
Database & Business Intelligence
1 3 (7.89%) Tableau
2 2 (5.26%) Power BI
Development Applications
1 16 (42.11%) Git
2 7 (18.42%) Bitbucket
3 6 (15.79%) JIRA
4 3 (7.89%) Cucumber
5 2 (5.26%) Jenkins
5 2 (5.26%) Team Foundation Server
6 1 (2.63%) ScriptRunner
6 1 (2.63%) Zephyr
General
1 17 (44.74%) Social Skills
2 14 (36.84%) Finance
3 7 (18.42%) Front Office
4 5 (13.16%) Banking
5 3 (7.89%) Analytical Skills
5 3 (7.89%) Public Sector
6 2 (5.26%) Financial Institution
6 2 (5.26%) Influencing Skills
7 1 (2.63%) Back Office
7 1 (2.63%) Legal
7 1 (2.63%) Organisational Skills
7 1 (2.63%) Telecoms
Job Titles
1 21 (55.26%) Developer
2 15 (39.47%) Java Developer
3 8 (21.05%) Angular Developer
4 5 (13.16%) Analyst
5 4 (10.53%) Low Latency Java Developer
5 4 (10.53%) Project Manager
6 3 (7.89%) Business Analyst
7 2 (5.26%) Architect
7 2 (5.26%) Python Developer
7 2 (5.26%) Senior
7 2 (5.26%) Technical Analyst
8 1 (2.63%) Automation Architect
8 1 (2.63%) Backend Developer
8 1 (2.63%) Digital Product Manager
8 1 (2.63%) Onboarding Analyst
8 1 (2.63%) React Developer
8 1 (2.63%) Salesforce Technical Architect
8 1 (2.63%) ScrumMaster Project Manager
8 1 (2.63%) Senior Salesforce Architect
8 1 (2.63%) Technical Programme Manager
Libraries, Frameworks & Software Standards
1 12 (31.58%) REST
2 8 (21.05%) AngularJS
2 8 (21.05%) React
3 7 (18.42%) Spring Boot
4 4 (10.53%) CSS
4 4 (10.53%) HTML
4 4 (10.53%) Web Services
4 4 (10.53%) ZK
5 3 (7.89%) FIX Protocol
5 3 (7.89%) Flask
5 3 (7.89%) Pandas
6 2 (5.26%) .NET
6 2 (5.26%) RESTful
7 1 (2.63%) Hibernate
7 1 (2.63%) Lightning Web Components
7 1 (2.63%) Spring
7 1 (2.63%) Swing
Miscellaneous
1 6 (15.79%) Foreign Exchange (FX)
2 4 (10.53%) Algorithms
2 4 (10.53%) Product Ownership
3 3 (7.89%) Linux Command Line
4 2 (5.26%) Onboarding
5 1 (2.63%) Analytical Mindset
5 1 (2.63%) Data Structures
5 1 (2.63%) Derivative
5 1 (2.63%) Fixed Income
Operating Systems
1 2 (5.26%) Linux
1 2 (5.26%) Unix
2 1 (2.63%) Windows
2 1 (2.63%) Windows Server
Processes & Methodologies
1 38 (100.00%) Agile
1 38 (100.00%) Scrum
2 13 (34.21%) TDD
3 12 (31.58%) Full-Stack Development
4 11 (28.95%) BDD
5 10 (26.32%) Test Automation
6 9 (23.68%) Problem-Solving
7 8 (21.05%) Project Delivery
8 7 (18.42%) Microservices
9 6 (15.79%) Stakeholder Management
10 5 (13.16%) Asset Management
10 5 (13.16%) Continuous Improvement
10 5 (13.16%) SDLC
11 4 (10.53%) Computer Science
11 4 (10.53%) DevOps
11 4 (10.53%) Low Latency
11 4 (10.53%) Product Backlog
11 4 (10.53%) Scaled Agile Framework
11 4 (10.53%) Sprint Planning
11 4 (10.53%) Unit Testing
Programming Languages
1 19 (50.00%) Java
2 13 (34.21%) Python
3 11 (28.95%) SQL
4 8 (21.05%) TypeScript
5 5 (13.16%) C#
6 4 (10.53%) JavaScript
7 2 (5.26%) PowerShell
8 1 (2.63%) Apex Code
8 1 (2.63%) Groovy
8 1 (2.63%) Korn
Qualifications
1 6 (15.79%) Degree
2 4 (10.53%) Computer Science Degree
3 3 (7.89%) Security Cleared
4 2 (5.26%) CBAP
4 2 (5.26%) ISEB
4 2 (5.26%) PMP
5 1 (2.63%) Microsoft Certification
5 1 (2.63%) Numerate Degree
5 1 (2.63%) PMI Certification
5 1 (2.63%) Postgraduate
5 1 (2.63%) SC Cleared
Quality Assurance & Compliance
1 4 (10.53%) QA
2 3 (7.89%) Data Quality
3 1 (2.63%) GRC
System Software
1 3 (7.89%) Docker
Systems Management
1 6 (15.79%) Ansible
2 1 (2.63%) HP ALM
2 1 (2.63%) Kubernetes
2 1 (2.63%) Opsgenie
Vendors
1 4 (10.53%) Microsoft
1 4 (10.53%) Oracle
2 3 (7.89%) Bloomberg
2 3 (7.89%) Cloudera
3 2 (5.26%) Salesforce
4 1 (2.63%) Alteryx
4 1 (2.63%) Atlassian
4 1 (2.63%) Blue Prism
4 1 (2.63%) HP
4 1 (2.63%) SAP
4 1 (2.63%) Splunk
4 1 (2.63%) UiPath