Relational Database Jobs in the City of London

Relational Database
Central London > City of London

The table below provides summary statistics for permanent job vacancies advertised in the City of London requiring Relational Database skills. It includes a benchmarking guide to the annual salaries offered in vacancies that cited Relational Database over the 6 months leading up to 20 August 2025, comparing them to the same period in the previous two years.

6 months to
20 Aug 2025
Same period 2024 Same period 2023
Rank 91 132 140
Rank change year-on-year +41 +8 -14
DemandTrendPermanent jobs citing Relational Database 47 42 72
As % of all permanent jobs advertised in the City of London 2.56% 1.42% 1.79%
As % of the Database & Business Intelligence category 11.90% 5.07% 8.04%
Number of salaries quoted 43 16 68
10th Percentile £66,250 £51,000 £58,750
25th Percentile £72,500 £62,188 £61,250
Median annual salary (50th Percentile) £85,000 £78,750 £82,500
Median % change year-on-year +7.94% -4.55% +10.00%
75th Percentile £102,500 £83,750 £110,000
90th Percentile £120,000 - £117,500
Central London median annual salary £85,000 £67,500 £82,500
% change year-on-year +25.93% -18.18% +4.76%

All Database and Business Intelligence Skills
City of London

Relational Database falls under the Databases and Business Intelligence category. For comparison with the information above, the following table provides summary statistics for all permanent job vacancies requiring database or business intelligence skills in the City of London.

DemandTrendPermanent vacancies with a requirement for database or business intelligence skills 395 828 896
As % of all permanent jobs advertised in the City of London 21.49% 28.03% 22.31%
Number of salaries quoted 302 525 768
10th Percentile £51,250 £46,250 £49,925
25th Percentile £62,625 £56,250 £57,500
Median annual salary (50th Percentile) £75,000 £72,500 £75,000
Median % change year-on-year +3.45% -3.33% +3.45%
75th Percentile £95,000 £92,500 £93,750
90th Percentile £120,000 £110,000 £111,625
Central London median annual salary £75,000 £70,000 £75,000
% change year-on-year +7.14% -6.67% +3.45%

Relational Database
Job Vacancy Trend in the City of London

Job postings citing Relational Database as a proportion of all IT jobs advertised in the City of London.
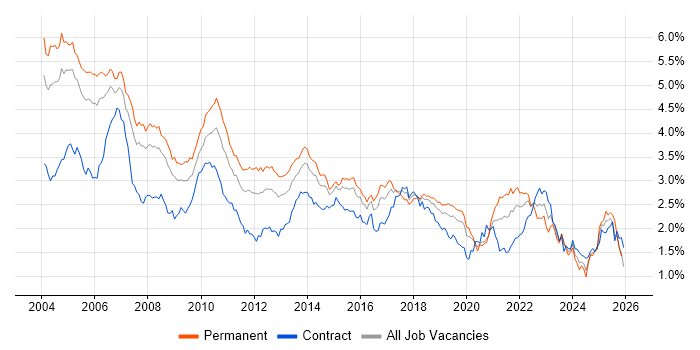
Job vacancy trend for Relational Database in the City of London

Relational Database
Salary Trend in the City of London

Salary distribution trend for jobs in the City of London citing Relational Database.

Salary distribution trend for jobs in the City of London citing Relational Database

Relational Database
Salary Histogram in the City of London

Salary distribution for jobs citing Relational Database in the City of London over the 6 months to 20 August 2025.

Salary histogram for Relational Database in the City of London

Relational Database
Co-occurring Skills and Capabilities in the City of London by Category

The follow tables expand on the table above by listing co-occurrences grouped by category. The same employment type, locality and period is covered with up to 20 co-occurrences shown in each of the following categories:

Application Platforms
1 6 (12.77%) Microsoft Exchange
2 2 (4.26%) Apache Airflow
3 1 (2.13%) Apache Spark
3 1 (2.13%) Luigi
3 1 (2.13%) NServiceBus
Applications
1 2 (4.26%) Microsoft Excel
1 2 (4.26%) Microsoft Office
Business Applications
1 4 (8.51%) Endur
2 2 (4.26%) Elite 3E
Cloud Services
1 17 (36.17%) Datadog
2 11 (23.40%) Azure
3 9 (19.15%) AWS
4 7 (14.89%) GCP
5 3 (6.38%) Power Platform
6 2 (4.26%) Pulumi
7 1 (2.13%) Azure AKS
7 1 (2.13%) Azure Service Bus
7 1 (2.13%) Boomi
7 1 (2.13%) dbt
7 1 (2.13%) GitHub
7 1 (2.13%) GitHub Actions
Communications & Networking
1 2 (4.26%) Broadband
Database & Business Intelligence
1 8 (17.02%) RDBMS
2 7 (14.89%) SQL Server
3 4 (8.51%) NoSQL
4 3 (6.38%) PostgreSQL
4 3 (6.38%) Power BI
5 2 (4.26%) SQL Server Reporting Services
6 1 (2.13%) Apache Cassandra
6 1 (2.13%) Data Warehouse
6 1 (2.13%) Hadoop
6 1 (2.13%) SQL Server Analysis Services
6 1 (2.13%) SQL Server Integration Services
Development Applications
1 2 (4.26%) Git
1 2 (4.26%) Jaeger
1 2 (4.26%) SpecFlow
1 2 (4.26%) Visual Studio
2 1 (2.13%) Moq
2 1 (2.13%) NeoLoad
General
1 7 (14.89%) Social Skills
2 6 (12.77%) Health Technology
3 5 (10.64%) Finance
4 2 (4.26%) Advertising
4 2 (4.26%) Analytical Skills
4 2 (4.26%) Banking
4 2 (4.26%) Games
4 2 (4.26%) Inclusion and Diversity
4 2 (4.26%) Organisational Skills
5 1 (2.13%) Documentation Skills
5 1 (2.13%) Investment Banking
5 1 (2.13%) Law
5 1 (2.13%) Legal
5 1 (2.13%) Pharmaceutical
5 1 (2.13%) Retail
Job Titles
1 24 (51.06%) Developer
2 9 (19.15%) Senior
3 5 (10.64%) Senior Software Engineer
3 5 (10.64%) Software Engineer
4 4 (8.51%) Analyst
4 4 (8.51%) ETRM Manager
4 4 (8.51%) Lead
5 2 (4.26%) Applications Support
5 2 (4.26%) C# Developer
5 2 (4.26%) Full-Stack Developer
5 2 (4.26%) Lead Programmer
5 2 (4.26%) Operational Support Analyst
5 2 (4.26%) Operations Analyst
5 2 (4.26%) Operations Support Specialist
5 2 (4.26%) Programmer
5 2 (4.26%) Qualitative Analyst
5 2 (4.26%) Quantitative Analyst
5 2 (4.26%) Senior Developer
5 2 (4.26%) Support Specialist
5 2 (4.26%) Team Leader
Libraries, Frameworks & Software Standards
1 7 (14.89%) AngularJS
1 7 (14.89%) Web Services
2 6 (12.77%) React
2 6 (12.77%) Vue
3 5 (10.64%) .NET
4 4 (8.51%) FIX Protocol
5 3 (6.38%) .NET Core
5 3 (6.38%) Elastic Stack
5 3 (6.38%) REST
5 3 (6.38%) XML
6 2 (4.26%) CSS
6 2 (4.26%) HTML
6 2 (4.26%) JSON
6 2 (4.26%) OpenTelemetry
7 1 (2.13%) .NET Framework
7 1 (2.13%) NumPy
7 1 (2.13%) OAuth
7 1 (2.13%) RESTful
7 1 (2.13%) SOAP
7 1 (2.13%) YAML
Miscellaneous
1 16 (34.04%) Onboarding
2 4 (8.51%) Cloud Native
2 4 (8.51%) Swaptions
3 2 (4.26%) Greenfield Project
3 2 (4.26%) VAX
4 1 (2.13%) Algorithms
4 1 (2.13%) Clustering
4 1 (2.13%) CMDB
4 1 (2.13%) Data Structures
4 1 (2.13%) Distributed Systems
4 1 (2.13%) Foreign Exchange (FX)
4 1 (2.13%) Legacy Systems
Operating Systems
1 4 (8.51%) Linux
1 4 (8.51%) Unix
2 2 (4.26%) Windows
3 1 (2.13%) VMS
Processes & Methodologies
1 22 (46.81%) DevOps
1 22 (46.81%) Migration
2 18 (38.30%) Scrum
2 18 (38.30%) Test Automation
3 17 (36.17%) CI/CD
3 17 (36.17%) Document Management
3 17 (36.17%) Error Analysis
3 17 (36.17%) Requirements Gathering
3 17 (36.17%) Stakeholder Management
4 12 (25.53%) Roadmaps
5 11 (23.40%) Agile
5 11 (23.40%) Problem-Solving
6 9 (19.15%) Artificial Intelligence
7 8 (17.02%) Computer Science
7 8 (17.02%) Software Engineering
8 6 (12.77%) Full-Stack Development
8 6 (12.77%) LLM
8 6 (12.77%) Mathematics
8 6 (12.77%) Task Automation
9 5 (10.64%) Technology Strategy
Programming Languages
1 32 (68.09%) Python
2 28 (59.57%) SQL
3 27 (57.45%) C#
3 27 (57.45%) Java
4 5 (10.64%) JavaScript
5 4 (8.51%) Bash
5 4 (8.51%) VB
6 2 (4.26%) COBOL
6 2 (4.26%) Go
6 2 (4.26%) TypeScript
7 1 (2.13%) C++
7 1 (2.13%) Scala
7 1 (2.13%) T-SQL
Qualifications
1 4 (8.51%) Degree
2 2 (4.26%) AWS Certification
2 2 (4.26%) Computer Science Degree
2 2 (4.26%) Numerate Degree
3 1 (2.13%) ISTQB
3 1 (2.13%) Master's Degree
Quality Assurance & Compliance
1 3 (6.38%) QA
2 1 (2.13%) Accessibility
2 1 (2.13%) CDISC
2 1 (2.13%) Data Quality
2 1 (2.13%) SLA
System Software
1 4 (8.51%) Docker
2 1 (2.13%) Active Directory
Systems Management
1 4 (8.51%) Kubernetes
2 3 (6.38%) Ansible
3 2 (4.26%) Argo
3 2 (4.26%) Kustomize
3 2 (4.26%) Prometheus
3 2 (4.26%) Terraform
4 1 (2.13%) Microsoft Clustering
4 1 (2.13%) Progress Chef
4 1 (2.13%) Puppet
Vendors
1 18 (38.30%) Guidewire
2 6 (12.77%) Oracle
3 5 (10.64%) Microsoft
4 4 (8.51%) OpenLink
4 4 (8.51%) Sybase
4 4 (8.51%) TIBCO
5 3 (6.38%) Intapp
6 2 (4.26%) Google
7 1 (2.13%) Aderant
7 1 (2.13%) iManage
7 1 (2.13%) Informatica
7 1 (2.13%) MuleSoft
7 1 (2.13%) RedGate
7 1 (2.13%) ServiceNow