Git Jobs in the Midlands

Git Distributed Version Control System
England > Midlands

The table below provides summary statistics for permanent job vacancies advertised in the Midlands requiring Git skills. It includes a benchmarking guide to the annual salaries offered in vacancies that cited Git over the 6 months leading up to 3 July 2025, comparing them to the same period in the previous two years.

6 months to
3 Jul 2025
Same period 2024 Same period 2023
Rank 125 112 68
Rank change year-on-year -13 -44 -31
Permanent jobs citing Git 161 290 375
As % of all permanent jobs advertised in the Midlands 2.35% 2.08% 4.59%
As % of the Development Applications category 27.52% 34.44% 37.39%
Number of salaries quoted 94 188 181
10th Percentile £36,250 £34,625 £36,250
25th Percentile £47,500 £40,000 £47,500
Median annual salary (50th Percentile) £60,000 £50,000 £57,500
Median % change year-on-year +20.00% -13.04% +15.00%
75th Percentile £73,750 £63,125 £67,500
90th Percentile - £77,875 £75,000
England median annual salary £65,000 £57,500 £65,000
% change year-on-year +13.04% -11.54% +4.00%

All Development Application Skills
Midlands

Git falls under the Development Applications category. For comparison with the information above, the following table provides summary statistics for all permanent job vacancies requiring development application skills in the Midlands.

Permanent vacancies with a requirement for development application skills 585 842 1,003
As % of all permanent jobs advertised in the Midlands 8.53% 6.04% 12.26%
Number of salaries quoted 311 618 517
10th Percentile £33,500 £32,500 £35,000
25th Percentile £42,500 £40,000 £45,000
Median annual salary (50th Percentile) £57,435 £50,000 £57,500
Median % change year-on-year +14.87% -13.04% +15.00%
75th Percentile £71,250 £62,500 £66,250
90th Percentile £75,000 £78,750 £77,500
England median annual salary £62,000 £58,000 £65,000
% change year-on-year +6.90% -10.77% +4.00%

Git
Job Vacancy Trend in the Midlands

Job postings citing Git as a proportion of all IT jobs advertised in the Midlands.
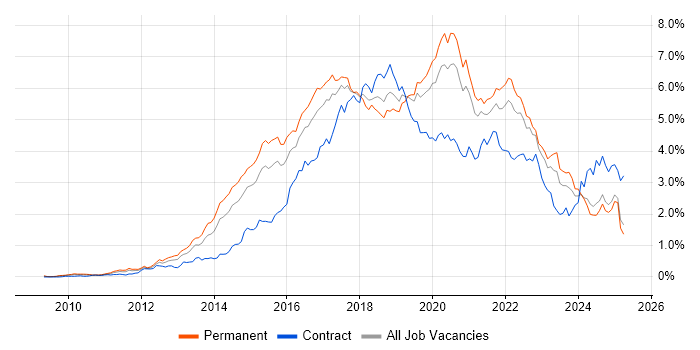
Job vacancy trend for Git in the Midlands

Git
Salary Trend in the Midlands

3-month moving average salary quoted in jobs citing Git in the Midlands.

Salary trend for Git in the Midlands

Git
Salary Histogram in the Midlands

Salary distribution for jobs citing Git in the Midlands over the 6 months to 3 July 2025.

Salary histogram for Git in the Midlands

Git
Job Locations in the Midlands

The table below looks at the demand and provides a guide to the median salaries quoted in IT jobs citing Git within the Midlands region over the 6 months to 3 July 2025. The 'Rank Change' column provides an indication of the change in demand within each location based on the same 6 month period last year.

Location Rank Change
on Same Period
Last Year
Matching
Permanent
IT Job Ads
Median Salary
Past 6 Months
Median Salary
% Change
on Same Period
Last Year
Live
Jobs
West Midlands +22 114 £65,000 +30.00% 217
East Midlands -8 47 £47,500 -5.00% 150
Git
England

Git
Co-occurring Skills and Capabilities in the Midlands by Category

The follow tables expand on the table above by listing co-occurrences grouped by category. The same employment type, locality and period is covered with up to 20 co-occurrences shown in each of the following categories:

Application Platforms
1 69 (42.86%) Confluence
2 8 (4.97%) CMS
3 6 (3.73%) WordPress
4 4 (2.48%) Apache Spark
4 4 (2.48%) nginx
5 1 (0.62%) Apache Airflow
5 1 (0.62%) ColdFusion
5 1 (0.62%) Headless CMS
5 1 (0.62%) JBoss
5 1 (0.62%) SAS
5 1 (0.62%) SharePoint
5 1 (0.62%) Sitefinity
5 1 (0.62%) Strapi
5 1 (0.62%) Tomcat
Applications
1 4 (2.48%) Mozilla Thunderbird
2 1 (0.62%) Adobe Creative Suite
2 1 (0.62%) MS Visio
2 1 (0.62%) Trello
Business Applications
1 6 (3.73%) Oracle EBS
1 6 (3.73%) Shopify
Cloud Services
1 67 (41.61%) AWS
2 49 (30.43%) Azure
3 45 (27.95%) Amazon EC2
3 45 (27.95%) Amazon S3
4 38 (23.60%) Amazon CloudWatch
4 38 (23.60%) AWS KMS
5 32 (19.88%) Amazon ELB
5 32 (19.88%) Virtual Private Cloud
6 28 (17.39%) Amazon Glacier
7 19 (11.80%) Azure DevOps
8 16 (9.94%) GitHub
9 10 (6.21%) Route 53
10 8 (4.97%) GCP
10 8 (4.97%) Power Platform
11 7 (4.35%) Amazon SQS
11 7 (4.35%) SaaS
11 7 (4.35%) Serverless
12 6 (3.73%) Amazon ECS
12 6 (3.73%) AWS Lambda
12 6 (3.73%) Slack
Communications & Networking
1 36 (22.36%) Firewall
2 22 (13.66%) DNS
3 21 (13.04%) HTTP
4 16 (9.94%) FTP
4 16 (9.94%) SMTP
4 16 (9.94%) SSH
5 5 (3.11%) OpenLDAP
5 5 (3.11%) VPN
6 4 (2.48%) IMAP
6 4 (2.48%) SD-WAN
6 4 (2.48%) WAN
7 3 (1.86%) LTE
7 3 (1.86%) Wi-Fi
7 3 (1.86%) Wireless
8 2 (1.24%) Modbus
9 1 (0.62%) Bluetooth
9 1 (0.62%) DHCP
9 1 (0.62%) Ethernet
9 1 (0.62%) PuTTY
9 1 (0.62%) TCP/IP
Database & Business Intelligence
1 47 (29.19%) MySQL
2 41 (25.47%) Amazon RDS
3 39 (24.22%) Relational Database
4 23 (14.29%) PostgreSQL
5 12 (7.45%) Amazon Aurora
6 11 (6.83%) Tableau
7 10 (6.21%) DynamoDB
7 10 (6.21%) NoSQL
8 8 (4.97%) SQL Server
9 7 (4.35%) Big Data
9 7 (4.35%) MongoDB
9 7 (4.35%) Power BI
10 4 (2.48%) Amazon Athena
10 4 (2.48%) Data Lake
10 4 (2.48%) RDBMS
10 4 (2.48%) Spark SQL
11 3 (1.86%) Parquet
11 3 (1.86%) Redis
12 1 (0.62%) HBase
12 1 (0.62%) Neo4j
Development Applications
1 75 (46.58%) JIRA
2 44 (27.33%) Jenkins
3 32 (19.88%) Vagrant
4 29 (18.01%) Bitbucket
5 14 (8.70%) JUnit
6 11 (6.83%) Maven
6 11 (6.83%) Sonatype Nexus
7 10 (6.21%) SonarQube
8 8 (4.97%) Subversion
9 7 (4.35%) Mockito
10 6 (3.73%) Bitbucket Server
10 6 (3.73%) DbUnit
10 6 (3.73%) jMock
11 5 (3.11%) NUnit
12 4 (2.48%) Postman
13 3 (1.86%) GitLab
13 3 (1.86%) Team Foundation Server
14 2 (1.24%) Cucumber
14 2 (1.24%) Mocha
14 2 (1.24%) webpack
General
1 39 (24.22%) Social Skills
2 38 (23.60%) Public Sector
3 20 (12.42%) Presentation Skills
4 17 (10.56%) Retail
5 15 (9.32%) Analytical Skills
6 12 (7.45%) Finance
7 6 (3.73%) Inclusion and Diversity
8 5 (3.11%) Marketing
9 3 (1.86%) Automotive
9 3 (1.86%) Games
10 2 (1.24%) Electronics
10 2 (1.24%) iGaming
10 2 (1.24%) Telecoms
11 1 (0.62%) Back Office
11 1 (0.62%) Law
11 1 (0.62%) Legal
11 1 (0.62%) Manufacturing
Job Titles
1 62 (38.51%) Developer
2 27 (16.77%) Senior
3 18 (11.18%) DevOps Engineer
3 18 (11.18%) Software Engineer
4 17 (10.56%) Systems Engineer
5 16 (9.94%) IT Engineer
6 15 (9.32%) AWS Engineer
6 15 (9.32%) Infrastructure Engineer
6 15 (9.32%) Senior Developer
7 14 (8.70%) Infrastructure Support
7 14 (8.70%) Infrastructure Support Engineer
7 14 (8.70%) Support Engineer
8 11 (6.83%) Java Developer
8 11 (6.83%) Lead
8 11 (6.83%) Senior Software Engineer
9 10 (6.21%) AWS Infrastructure Engineer
9 10 (6.21%) Front-End Developer (Client-Side Developer)
10 9 (5.59%) C# Developer
10 9 (5.59%) Lead Developer
11 8 (4.97%) .NET Developer
Libraries, Frameworks & Software Standards
1 52 (32.30%) .NET
2 30 (18.63%) HTML
3 28 (17.39%) CSS
4 21 (13.04%) React
5 20 (12.42%) RESTful
6 16 (9.94%) AngularJS
7 14 (8.70%) Bootstrap
7 14 (8.70%) Laravel
7 14 (8.70%) REST
7 14 (8.70%) Spring
8 13 (8.07%) .NET Core
9 12 (7.45%) SOAP
10 11 (6.83%) Node.js
10 11 (6.83%) Spring Boot
10 11 (6.83%) Vue
10 11 (6.83%) Web Services
11 10 (6.21%) .NET Framework
11 10 (6.21%) Hibernate
11 10 (6.21%) jQuery
12 9 (5.59%) JSON
Miscellaneous
1 24 (14.91%) Replication
2 10 (6.21%) Cloud Native
3 6 (3.73%) Greenfield Project
3 6 (3.73%) IoT
4 5 (3.11%) Mobile App
5 4 (2.48%) Data Centre
5 4 (2.48%) Distributed Architecture
5 4 (2.48%) NHS
5 4 (2.48%) Onboarding
5 4 (2.48%) Self-Motivation
6 3 (1.86%) Distributed Systems
6 3 (1.86%) Product Ownership
6 3 (1.86%) Raspberry Pi
6 3 (1.86%) Virtual Team
7 2 (1.24%) Animation
7 2 (1.24%) Data Protection Act
7 2 (1.24%) Legacy Systems
7 2 (1.24%) Low-Code
7 2 (1.24%) Management Information System
8 1 (0.62%) Legacy Applications
Operating Systems
1 72 (44.72%) Linux
2 54 (33.54%) Windows
3 32 (19.88%) VMS
4 17 (10.56%) Amazon Linux
5 5 (3.11%) Ubuntu
6 4 (2.48%) Android
6 4 (2.48%) Apple iOS
7 3 (1.86%) Unix
8 2 (1.24%) CentOS
8 2 (1.24%) Debian
Processes & Methodologies
1 77 (47.83%) Agile
2 67 (41.61%) DevOps
3 61 (37.89%) CI/CD
4 39 (24.22%) Continuous Integration
4 39 (24.22%) Problem-Solving
5 34 (21.12%) Configuration Management
6 32 (19.88%) Cloud Security
7 31 (19.25%) Change Management
7 31 (19.25%) Coaching
8 27 (16.77%) Continuous Deployment
8 27 (16.77%) DevSecOps
9 25 (15.53%) Software Engineering
9 25 (15.53%) Web Development
10 21 (13.04%) Microservices
11 20 (12.42%) Front End Development
12 19 (11.80%) Mentoring
13 18 (11.18%) Scrum
14 17 (10.56%) Infrastructure Engineering
14 17 (10.56%) Patch Management
15 16 (9.94%) Systems Engineering
Programming Languages
1 64 (39.75%) Python
2 54 (33.54%) C#
3 48 (29.81%) SQL
4 37 (22.98%) PowerShell
5 36 (22.36%) Java
6 34 (21.12%) JavaScript
7 32 (19.88%) Groovy
8 15 (9.32%) PHP
9 13 (8.07%) Perl
10 8 (4.97%) TypeScript
11 4 (2.48%) Bicep
12 3 (1.86%) C
12 3 (1.86%) Shell Script
13 2 (1.24%) Embedded C
13 2 (1.24%) Swift
14 1 (0.62%) Bash
14 1 (0.62%) Dart
14 1 (0.62%) Kotlin
14 1 (0.62%) PROC SQL
14 1 (0.62%) R
Qualifications
1 50 (31.06%) Security Cleared
2 43 (26.71%) SC Cleared
3 30 (18.63%) BPSS Clearance
4 27 (16.77%) Degree
5 15 (9.32%) Azure Certification
5 15 (9.32%) DBS Check
6 10 (6.21%) AWS Certification
7 9 (5.59%) Computer Science Degree
8 7 (4.35%) Master's Degree
9 1 (0.62%) DV Cleared
9 1 (0.62%) HND
9 1 (0.62%) ISTQB
Quality Assurance & Compliance
1 7 (4.35%) QA
2 1 (0.62%) Accessibility
2 1 (0.62%) Data Quality
System Software
1 42 (26.09%) Docker
2 27 (16.77%) Active Directory
3 24 (14.91%) DFS Replication
4 6 (3.73%) Postfix
5 5 (3.11%) Firmware
6 4 (2.48%) Dovecot
6 4 (2.48%) Squid
6 4 (2.48%) Virtual Machines
7 2 (1.24%) Embedded Firmware
8 1 (0.62%) Apache Flume
8 1 (0.62%) HDFS
Systems Management
1 43 (26.71%) Ansible
2 38 (23.60%) Grafana
2 38 (23.60%) Prometheus
3 37 (22.98%) Terraform
4 16 (9.94%) Kubernetes
5 5 (3.11%) Nessus
6 4 (2.48%) Proxmox
6 4 (2.48%) Single Sign-On
7 2 (1.24%) Puppet
8 1 (0.62%) Kibana
8 1 (0.62%) logstash
8 1 (0.62%) Oozie
8 1 (0.62%) Progress Chef
Vendors
1 33 (20.50%) Atlassian
2 32 (19.88%) ServiceNow
3 15 (9.32%) Databricks
3 15 (9.32%) Juniper
4 14 (8.70%) Microsoft
5 11 (6.83%) Oracle
6 6 (3.73%) Jaspersoft
7 5 (3.11%) WooCommerce
8 4 (2.48%) Meraki
8 4 (2.48%) Okta
9 3 (1.86%) Telerik
10 2 (1.24%) Atmel
10 2 (1.24%) Google
10 2 (1.24%) SAP
11 1 (0.62%) Adobe
11 1 (0.62%) Borland
11 1 (0.62%) Informatica
11 1 (0.62%) MicroStrategy
11 1 (0.62%) Red Hat
11 1 (0.62%) Sophos