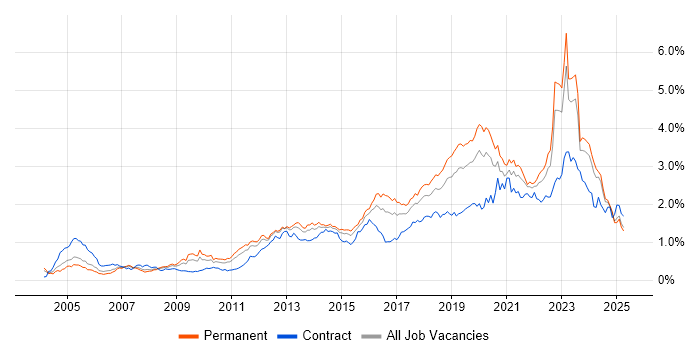
Infrastructure Engineering Job Trends in the Midlands

Infrastructure Engineering
England > Midlands

The table below provides summary statistics and salary benchmarking for jobs advertised in the Midlands requiring Infrastructure Engineering skills. It covers vacancies from the 6 months leading up to 19 September 2025, with comparisons to the same periods in the previous two years.

6 months to
19 Sep 2025
Same period 2024 Same period 2023
Rank 107 78 37
Rank change year-on-year -29 -41 +60
Permanent jobs citing Infrastructure Engineering 149 296 355
As % of all permanent jobs advertised in the Midlands 2.66% 2.93% 6.28%
As % of the Processes & Methodologies category 3.10% 3.73% 6.66%
Number of salaries quoted 101 191 167
10th Percentile £31,250 £35,000 £35,875
25th Percentile £32,500 £37,500 £41,250
Median annual salary (50th Percentile) £53,688 £47,000 £49,565
Median % change year-on-year +14.23% -5.18% +10.14%
75th Percentile £73,750 £58,125 £57,500
90th Percentile £80,000 £61,250 £62,500
England median annual salary £60,000 £50,000 £52,500
% change year-on-year +20.00% -4.76% +0.96%

All Process and Methodology Skills
Midlands

Infrastructure Engineering falls under the Processes and Methodologies category. For comparison with the information above, the following table provides summary statistics for all permanent job vacancies requiring process or methodology skills in the Midlands.

Permanent vacancies with a requirement for process or methodology skills 4,806 7,941 5,327
As % of all permanent jobs advertised in the Midlands 85.73% 78.68% 94.17%
Number of salaries quoted 2,881 4,021 3,852
10th Percentile £27,000 £29,000 £27,500
25th Percentile £32,500 £36,250 £38,219
Median annual salary (50th Percentile) £47,500 £50,000 £52,500
Median % change year-on-year -5.00% -4.76% +5.00%
75th Percentile £63,250 £65,000 £66,250
90th Percentile £77,500 £77,500 £78,750
England median annual salary £55,000 £57,500 £62,500
% change year-on-year -4.35% -8.00% +4.17%

Infrastructure Engineering
Job Vacancy Trend in the Midlands

Job postings citing Infrastructure Engineering as a proportion of all IT jobs advertised in the Midlands.

Job vacancy trend for Infrastructure Engineering in the Midlands

Infrastructure Engineering
Salary Trend in the Midlands

Salary distribution trend for jobs in the Midlands citing Infrastructure Engineering.

Salary distribution trend for jobs in the Midlands citing Infrastructure Engineering

Infrastructure Engineering
Salary Histogram in the Midlands

Salary distribution for jobs citing Infrastructure Engineering in the Midlands over the 6 months to 19 September 2025.

Salary histogram for Infrastructure Engineering in the Midlands

Infrastructure Engineering
Job Locations in the Midlands

The table below looks at the demand and provides a guide to the median salaries quoted in IT jobs citing Infrastructure Engineering within the Midlands region over the 6 months to 19 September 2025. The 'Rank Change' column provides an indication of the change in demand within each location based on the same 6 month period last year.

Location Rank Change
on Same Period
Last Year
Matching
Permanent
IT Job Ads
Median Salary
Past 6 Months
Median Salary
% Change
on Same Period
Last Year
Live
Jobs
West Midlands -1 99 £65,000 +28.08% 15
East Midlands -37 49 £35,000 -21.35% 25
Infrastructure Engineering
England

Infrastructure Engineering
Co-occurring Skills and Capabilities in the Midlands by Category

The follow tables expand on the table above by listing co-occurrences grouped by category. The same employment type, locality and period is covered with up to 20 co-occurrences shown in each of the following categories:

Application Platforms
1 38 (25.50%) Microsoft Exchange
2 17 (11.41%) SharePoint
3 16 (10.74%) Confluence
4 9 (6.04%) Skype for Business
5 5 (3.36%) CMS
6 4 (2.68%) WinCC
7 3 (2.01%) IIS
8 2 (1.34%) FactoryTalk
Applications
1 9 (6.04%) Microsoft Office
2 2 (1.34%) Microsoft Excel
3 1 (0.67%) Mozilla Thunderbird
Business Applications
1 5 (3.36%) Dynamics CRM
Cloud Services
1 60 (40.27%) Azure
2 45 (30.20%) Microsoft 365
3 40 (26.85%) AWS
4 18 (12.08%) Amazon EC2
5 17 (11.41%) Entra ID
6 16 (10.74%) Amazon S3
6 16 (10.74%) AWS KMS
6 16 (10.74%) Virtual Private Cloud
7 15 (10.07%) Amazon CloudWatch
7 15 (10.07%) Amazon ELB
7 15 (10.07%) Amazon Glacier
7 15 (10.07%) SaaS
8 13 (8.72%) Azure Sentinel
9 10 (6.71%) GCP
10 8 (5.37%) Azure Stack
10 8 (5.37%) Nutanix
11 7 (4.70%) GitHub
12 6 (4.03%) Mimecast
13 5 (3.36%) Dynamics 365
13 5 (3.36%) IaaS
Communications & Networking
1 58 (38.93%) Firewall
2 35 (23.49%) DHCP
3 34 (22.82%) DNS
4 32 (21.48%) VPN
5 27 (18.12%) WAN
6 19 (12.75%) TCP/IP
7 18 (12.08%) VLAN
8 16 (10.74%) LAN
9 9 (6.04%) Skype
10 8 (5.37%) Cisco IOS
10 8 (5.37%) SAN
10 8 (5.37%) SD-WAN
11 6 (4.03%) Wi-Fi
12 4 (2.68%) Modbus
13 3 (2.01%) Softphone
14 2 (1.34%) HTTPS
14 2 (1.34%) Network Security
14 2 (1.34%) SSL
15 1 (0.67%) HTTP
15 1 (0.67%) RTP
Database & Business Intelligence
1 17 (11.41%) Amazon RDS
2 8 (5.37%) DTS
2 8 (5.37%) SQL Server
3 5 (3.36%) Data Hub
3 5 (3.36%) SQL CLR
4 3 (2.01%) SQL Server Analysis Services
4 3 (2.01%) SQL Server Reporting Services
5 2 (1.34%) Metadata
5 2 (1.34%) Power BI
6 1 (0.67%) RDBMS
6 1 (0.67%) Relational Database
6 1 (0.67%) SQL Server Integration Services
Development Applications
1 17 (11.41%) Git
1 17 (11.41%) Jenkins
1 17 (11.41%) JIRA
2 15 (10.07%) Vagrant
3 4 (2.68%) Sonatype Nexus
4 1 (0.67%) Bitbucket Server
4 1 (0.67%) Team Foundation Server
General
1 42 (28.19%) Public Sector
2 28 (18.79%) Social Skills
3 15 (10.07%) Finance
4 14 (9.40%) Law
5 13 (8.72%) Manufacturing
6 11 (7.38%) Analytical Skills
7 10 (6.71%) Back Office
7 10 (6.71%) Inclusion and Diversity
8 9 (6.04%) Retail
9 7 (4.70%) Local Government
10 6 (4.03%) Legal
11 4 (2.68%) Documentation Skills
12 3 (2.01%) Publishing
13 1 (0.67%) Organisational Skills
13 1 (0.67%) Presentation Skills
Job Titles
1 123 (82.55%) Infrastructure Engineer
2 49 (32.89%) Support Engineer
3 48 (32.21%) Infrastructure Support
3 48 (32.21%) Infrastructure Support Engineer
4 28 (18.79%) IT Engineer
4 28 (18.79%) IT Infrastructure Engineer
5 13 (8.72%) Senior
6 11 (7.38%) AWS Engineer
6 11 (7.38%) AWS Infrastructure Engineer
6 11 (7.38%) Senior Infrastructure Engineer
7 10 (6.71%) IT Support
8 8 (5.37%) Analyst
9 7 (4.70%) Civil Engineer
9 7 (4.70%) Cloud Engineer
9 7 (4.70%) Development Engineer
9 7 (4.70%) Lead
9 7 (4.70%) Support Analyst
10 6 (4.03%) Infrastructure Analyst
10 6 (4.03%) IT Support Engineer
11 5 (3.36%) Applications Support Engineer
Libraries, Frameworks & Software Standards
1 10 (6.71%) Elastic Stack
2 3 (2.01%) .NET
2 3 (2.01%) .NET Core
2 3 (2.01%) .NET Framework
2 3 (2.01%) Dapper ORM
2 3 (2.01%) EDI
2 3 (2.01%) Entity Framework
2 3 (2.01%) OLE
3 2 (1.34%) OAuth
3 2 (1.34%) SAML
4 1 (0.67%) YAML
Miscellaneous
1 25 (16.78%) Onboarding
2 14 (9.40%) Data Centre
2 14 (9.40%) Replication
3 8 (5.37%) CMDB
3 8 (5.37%) Cyberattack
3 8 (5.37%) Hybrid Cloud
3 8 (5.37%) Operational Technology
3 8 (5.37%) Video Conferencing
4 7 (4.70%) NHS
5 6 (4.03%) Legacy Systems
6 5 (3.36%) Clustering
6 5 (3.36%) Driving Licence
6 5 (3.36%) Private Cloud
6 5 (3.36%) SCADA
6 5 (3.36%) Security Posture
7 4 (2.68%) Enterprise Software
8 3 (2.01%) Enterprise Storage
8 3 (2.01%) Renewable Energy
8 3 (2.01%) Security Operations Centre
8 3 (2.01%) Team-Oriented Environment
Operating Systems
1 103 (69.13%) Windows
2 63 (42.28%) Windows Server
3 40 (26.85%) Linux
4 20 (13.42%) Windows Server 2019
5 17 (11.41%) Windows Server 2016
6 16 (10.74%) VMS
7 11 (7.38%) Windows 10
8 9 (6.04%) Windows Server 2008
9 8 (5.37%) Android
9 8 (5.37%) Rocky
10 5 (3.36%) Mac OS
10 5 (3.36%) Windows Server 2012
11 3 (2.01%) Red Hat Enterprise Linux
11 3 (2.01%) Unix
12 2 (1.34%) Ubuntu
13 1 (0.67%) Windows Server 2003
Processes & Methodologies
1 36 (24.16%) DevOps
2 34 (22.82%) Problem-Solving
3 21 (14.09%) Change Management
3 21 (14.09%) Disaster Recovery
4 20 (13.42%) Cloud Security
4 20 (13.42%) Cybersecurity
5 19 (12.75%) ITIL
6 18 (12.08%) Configuration Management
7 16 (10.74%) Agile
8 15 (10.07%) Customer Service
8 15 (10.07%) Server Management
9 14 (9.40%) Line Management
10 13 (8.72%) Containerisation
10 13 (8.72%) Risk Management
10 13 (8.72%) Root Cause Analysis
11 12 (8.05%) High Availability
11 12 (8.05%) Infrastructure Management
11 12 (8.05%) Mentoring
11 12 (8.05%) Problem Management
12 10 (6.71%) Continuous Improvement
Programming Languages
1 42 (28.19%) PowerShell
2 28 (18.79%) Python
3 17 (11.41%) SQL
4 15 (10.07%) Groovy
5 11 (7.38%) Bash
6 3 (2.01%) C#
7 2 (1.34%) Perl
7 2 (1.34%) Shell Script
7 2 (1.34%) T-SQL
8 1 (0.67%) Go
Qualifications
1 32 (21.48%) Security Cleared
2 27 (18.12%) Microsoft Certification
3 26 (17.45%) SC Cleared
4 19 (12.75%) MCP
5 17 (11.41%) Azure Certification
6 16 (10.74%) A+ Certification
6 16 (10.74%) Degree
7 14 (9.40%) MCSA
8 13 (8.72%) DV Cleared
9 12 (8.05%) Network+ Certification
10 10 (6.71%) MCSE
11 8 (5.37%) BPSS Clearance
12 3 (2.01%) AWS Certification
12 3 (2.01%) CompTIA Security+
13 2 (1.34%) CCNP
13 2 (1.34%) Cisco Certification
14 1 (0.67%) CISA
14 1 (0.67%) CISM
14 1 (0.67%) GIAC
14 1 (0.67%) ITIL Certification
Quality Assurance & Compliance
1 7 (4.70%) Cyber Essentials
1 7 (4.70%) GDPR
2 6 (4.03%) ISO/IEC 27001
3 5 (3.36%) Cyber Essentials PLUS
3 5 (3.36%) QA
4 4 (2.68%) Accessibility
4 4 (2.68%) IEC 61508
5 2 (1.34%) IEC 61131
5 2 (1.34%) NIST
5 2 (1.34%) SLA
6 1 (0.67%) PCI DSS
System Software
1 82 (55.03%) Active Directory
2 30 (20.13%) Hyper-V
3 29 (19.46%) VMware Infrastructure
4 14 (9.40%) DFS Replication
5 11 (7.38%) Docker
6 10 (6.71%) vSphere
7 9 (6.04%) Virtual Desktop
8 8 (5.37%) VMware NSX
9 3 (2.01%) Virtual Machines
10 2 (1.34%) Firmware
10 2 (1.34%) vCloud
10 2 (1.34%) VMware ESXi
Systems Management
1 32 (21.48%) Terraform
2 30 (20.13%) Ansible
3 15 (10.07%) Grafana
3 15 (10.07%) Prometheus
4 9 (6.04%) Kubernetes
5 8 (5.37%) Nagios
5 8 (5.37%) ZABBIX
6 7 (4.70%) Failover Clustering
6 7 (4.70%) SCCM
7 6 (4.03%) Microsoft Intune
8 4 (2.68%) Puppet
9 3 (2.01%) Progress Chef
9 3 (2.01%) SCOM
10 2 (1.34%) FortiGate
10 2 (1.34%) Nessus
10 2 (1.34%) vCenter Server
11 1 (0.67%) Proxmox
11 1 (0.67%) SCOrch
11 1 (0.67%) SCSM
11 1 (0.67%) WSUS
Vendors
1 69 (46.31%) Microsoft
2 33 (22.15%) VMware
3 24 (16.11%) Juniper
4 17 (11.41%) Cisco
4 17 (11.41%) ServiceNow
5 12 (8.05%) Dell
6 11 (7.38%) Citrix
6 11 (7.38%) Red Hat
7 10 (6.71%) Splunk
8 9 (6.04%) SolarWinds
8 9 (6.04%) Tanium
9 8 (5.37%) 3PAR
9 8 (5.37%) BMC
9 8 (5.37%) Darktrace
9 8 (5.37%) Google
9 8 (5.37%) Meraki
9 8 (5.37%) Proofpoint
9 8 (5.37%) Trend Micro
9 8 (5.37%) Veeam
10 7 (4.70%) Rapid7