Inclusion and Diversity Jobs in England

Inclusion and Diversity
UK > England

The table below looks at the prevalence of the term Inclusion and Diversity in permanent job vacancies advertised in England. Included is a benchmarking guide to the salaries offered in vacancies that have cited Inclusion and Diversity over the 6 months to 30 November 2023 with a comparison to the same period over the previous 2 years.

6 months to
30 Nov 2023
Same period 2022 Same period 2021
Rank 47 34 194
Rank change year-on-year -13 +160 +332
Permanent jobs citing Inclusion and Diversity 2,551 7,720 2,228
As % of all permanent jobs advertised in England 5.40% 6.99% 1.97%
As % of the General category 8.31% 10.20% 3.31%
Number of salaries quoted 1,125 2,477 717
10th Percentile £38,500 £33,587 £28,700
25th Percentile £53,017 £47,250 £37,750
Median annual salary (50th Percentile) £70,000 £62,500 £55,000
Median % change year-on-year +12.00% +13.64% -
75th Percentile £87,500 £82,600 £70,000
90th Percentile £108,750 £100,000 £85,000
UK median annual salary £65,000 £62,000 £53,500
% change year-on-year +4.84% +15.89% -2.73%

All General Skills
England

Inclusion and Diversity is in the General Skills category. The following table is for comparison with the above and provides summary statistics for all permanent job vacancies advertised in England with a requirement for common skills.

Permanent vacancies with a requirement for common skills 30,716 75,698 67,217
As % of all permanent jobs advertised in England 65.00% 68.57% 59.44%
Number of salaries quoted 21,963 44,008 42,408
10th Percentile £31,250 £32,500 £31,250
25th Percentile £42,500 £45,000 £42,500
Median annual salary (50th Percentile) £60,000 £60,000 £60,000
Median % change year-on-year - - +4.35%
75th Percentile £82,500 £82,500 £80,000
90th Percentile £102,500 £101,250 £97,500
UK median annual salary £60,000 £60,000 £57,500
% change year-on-year - +4.35% +4.55%

Inclusion and Diversity
Job Vacancy Trend in England

Job postings citing Inclusion and Diversity as a proportion of all IT jobs advertised in England.
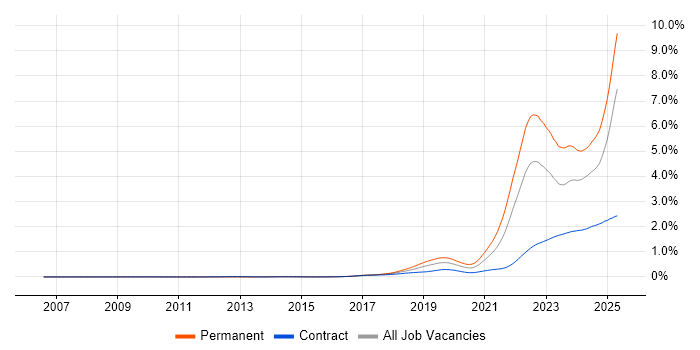
Job vacancy trend for Inclusion and Diversity in England

Inclusion and Diversity
Salary Trend in England

3-month moving average salary quoted in jobs citing Inclusion and Diversity in England.

Salary trend for Inclusion and Diversity in England

Inclusion and Diversity
Salary Histogram in England

Salary distribution for jobs citing Inclusion and Diversity in England over the 6 months to 30 November 2023.

Salary histogram for Inclusion and Diversity in England

Inclusion and Diversity
Job Locations in England

The table below looks at the demand and provides a guide to the median salaries quoted in IT jobs citing Inclusion and Diversity within the England region over the 6 months to 30 November 2023. The 'Rank Change' column provides an indication of the change in demand within each location based on the same 6 month period last year.

Location Rank Change
on Same Period
Last Year
Matching
Permanent
IT Job Ads
Median Salary
Past 6 Months
Median Salary
% Change
on Same Period
Last Year
Live
Jobs
London -9 1,146 £75,000 +7.14% 677
South East +5 403 £63,856 +44.00% 259
North of England -10 348 £60,000 +9.33% 205
Midlands +82 238 £55,000 +21.32% 108
North West -13 207 £51,380 +0.82% 130
South West -58 202 £50,000 +5.26% 107
West Midlands +121 194 £55,000 +24.55% 63
Yorkshire -7 109 £75,000 +36.36% 42
East of England -12 71 £50,000 +5.26% 137
East Midlands -6 44 £76,250 +45.24% 44
North East +51 32 £62,500 -3.85% 36
Inclusion and Diversity
UK

Inclusion and Diversity
Co-occurring Skills and Capabilities in England by Category

The follow tables expand on the table above by listing co-occurrences grouped by category. The same employment type, locality and period is covered with up to 20 co-occurrences shown in each of the following categories:

Application Platforms
1 89 (3.49%) SAS
2 59 (2.31%) SharePoint
3 27 (1.06%) Confluence
4 14 (0.55%) MS Exchange
5 13 (0.51%) CMS
5 13 (0.51%) WordPress
6 12 (0.47%) Jupyter
7 9 (0.35%) Apache
8 8 (0.31%) Drupal
9 6 (0.24%) Apache Spark
10 3 (0.12%) Mendix
11 2 (0.078%) ArcGIS
11 2 (0.078%) IIS
12 1 (0.039%) Apache Airflow
12 1 (0.039%) Apache Pulsar
12 1 (0.039%) NetWeaver
12 1 (0.039%) nginx
Applications
1 95 (3.72%) Microsoft Excel
2 87 (3.41%) Microsoft Office
3 17 (0.67%) Microsoft PowerPoint
4 14 (0.55%) Photoshop
5 13 (0.51%) Adobe Illustrator
6 8 (0.31%) Adobe XD
6 8 (0.31%) MS Visio
6 8 (0.31%) Spreadsheet
6 8 (0.31%) Windchill
7 6 (0.24%) Microsoft Project
7 6 (0.24%) Sketch
8 4 (0.16%) AutoCAD
9 3 (0.12%) OrCAD
9 3 (0.12%) Stata
10 2 (0.078%) CATIA
10 2 (0.078%) InfoPath
10 2 (0.078%) InVision
11 1 (0.039%) Abaqus
11 1 (0.039%) Open Workbench
11 1 (0.039%) Simulink
Business Applications
1 31 (1.22%) Oracle Payables
2 27 (1.06%) Oracle Receivables
3 19 (0.74%) SAP S/4HANA
4 18 (0.71%) Dynamics CRM
5 15 (0.59%) Endur
6 14 (0.55%) SAP SCM
7 13 (0.51%) NetSuite
8 8 (0.31%) SAP EWM
9 7 (0.27%) SAP QM
10 6 (0.24%) Oracle EBS
11 5 (0.20%) Oracle Procure-to-Pay
11 5 (0.20%) SAP Payroll
12 4 (0.16%) SAP SD
13 3 (0.12%) SAP CO
13 3 (0.12%) SAP FI
13 3 (0.12%) SAP FI/CO
13 3 (0.12%) SAP PM
13 3 (0.12%) SAP PS
13 3 (0.12%) SAP WM
14 2 (0.078%) SAP CRM
Cloud Services
1 513 (20.11%) Azure
2 338 (13.25%) AWS
3 186 (7.29%) GCP
4 131 (5.14%) Power Platform
5 118 (4.63%) PaaS
6 107 (4.19%) SaaS
7 104 (4.08%) Microsoft 365
8 103 (4.04%) IaaS
9 59 (2.31%) AWS CloudFormation
9 59 (2.31%) Azure DevOps
10 52 (2.04%) dbt
11 44 (1.72%) OpenShift
12 39 (1.53%) Serverless
13 35 (1.37%) Dynamics 365
14 26 (1.02%) Entra ID
15 25 (0.98%) Amazon ECS
16 24 (0.94%) Cloud Computing
16 24 (0.94%) SuccessFactors
17 23 (0.90%) AWS Lambda
18 21 (0.82%) BlazeMeter
Communications & Networking
1 133 (5.21%) TCP/IP
2 109 (4.27%) DNS
3 94 (3.68%) DHCP
4 72 (2.82%) HTTP
5 43 (1.69%) VPN
6 34 (1.33%) Firewall
6 34 (1.33%) LAN
6 34 (1.33%) WAN
7 30 (1.18%) 5G
7 30 (1.18%) Broadband
8 28 (1.10%) Wireless
9 25 (0.98%) Unified Communications
10 17 (0.67%) BGP
11 15 (0.59%) MPLS
11 15 (0.59%) SAN
11 15 (0.59%) SD-WAN
12 13 (0.51%) VoIP
12 13 (0.51%) WebEx
13 12 (0.47%) H.323
13 12 (0.47%) IOS XR
Database & Business Intelligence
1 116 (4.55%) Metadata
2 110 (4.31%) Power BI
3 86 (3.37%) Data Warehouse
4 83 (3.25%) Base SAS
5 82 (3.21%) MongoDB
6 78 (3.06%) Elasticsearch
7 70 (2.74%) Big Data
8 64 (2.51%) SQL Server
9 56 (2.20%) Data Lake
10 53 (2.08%) NoSQL
11 32 (1.25%) SQL Server Reporting Services
12 31 (1.22%) Hadoop
13 29 (1.14%) PostgreSQL
13 29 (1.14%) SQL Server Integration Services
14 25 (0.98%) Tableau
15 22 (0.86%) QlikView
16 21 (0.82%) Redis
17 16 (0.63%) Oracle Database
17 16 (0.63%) Oracle Database 10g
17 16 (0.63%) Oracle Database 11g
Development Applications
1 78 (3.06%) Jenkins
2 64 (2.51%) Git
3 62 (2.43%) Cucumber
4 55 (2.16%) Selenium
5 52 (2.04%) JIRA
6 30 (1.18%) Maven
7 27 (1.06%) Cypress.io
8 26 (1.02%) REST Assured
9 24 (0.94%) eggPlant
10 23 (0.90%) GitLab
11 22 (0.86%) Postman
12 19 (0.74%) JMeter
12 19 (0.74%) LoadRunner
13 16 (0.63%) SoapUI
13 16 (0.63%) The Grinder
14 14 (0.55%) JUnit
14 14 (0.55%) WebDriver
15 11 (0.43%) Oracle Forms
16 9 (0.35%) ClearCase
16 9 (0.35%) Mockito
General
1 812 (31.83%) Finance
2 763 (29.91%) Social Skills
3 222 (8.70%) Retail
4 186 (7.29%) Analytical Skills
5 153 (6.00%) Public Sector
6 128 (5.02%) Legal
7 124 (4.86%) Banking
8 111 (4.35%) Law
9 105 (4.12%) Pharmaceutical
10 98 (3.84%) Marketing
11 90 (3.53%) Aerospace
12 65 (2.55%) Telecoms
13 61 (2.39%) Billing
14 57 (2.23%) Presentation Skills
15 54 (2.12%) Influencing Skills
16 40 (1.57%) Advertising
17 35 (1.37%) Manufacturing
17 35 (1.37%) Organisational Skills
18 28 (1.10%) Aviation
19 25 (0.98%) Electronics
Job Titles
1 468 (18.35%) Senior
2 382 (14.97%) Analyst
3 282 (11.05%) Lead
4 225 (8.82%) Developer
5 205 (8.04%) Architect
6 121 (4.74%) Project Manager
7 114 (4.47%) Software Engineer
8 94 (3.68%) Consultant
9 84 (3.29%) Infrastructure Engineer
10 73 (2.86%) Business Analyst
11 70 (2.74%) Programmer
12 67 (2.63%) DevOps Engineer
12 67 (2.63%) Senior Analyst
13 66 (2.59%) SAS Programmer
13 66 (2.59%) SAS Statistical Programmer
13 66 (2.59%) Solutions Architect
13 66 (2.59%) Statistical Programmer
14 63 (2.47%) IT Manager
15 57 (2.23%) Audit Manager
16 54 (2.12%) Senior Developer
Libraries, Frameworks & Software Standards
1 167 (6.55%) HTML
2 112 (4.39%) .NET
3 96 (3.76%) REST
4 91 (3.57%) React
5 83 (3.25%) XML
6 77 (3.02%) EDI
7 67 (2.63%) OpenID
8 65 (2.55%) CSS
9 62 (2.43%) Node.js
10 56 (2.20%) Kafka
11 49 (1.92%) Web Services
12 38 (1.49%) SAML
13 37 (1.45%) JWT
13 37 (1.45%) Velocity
14 34 (1.33%) AngularJS
15 33 (1.29%) Protocol Buffers
16 32 (1.25%) JSON
17 31 (1.22%) Spring
18 29 (1.14%) Django
19 23 (0.90%) Spring Boot
Miscellaneous
1 151 (5.92%) Cyberattack
2 134 (5.25%) Management Information System
3 122 (4.78%) Self-Motivation
4 118 (4.63%) Onboarding
5 108 (4.23%) Product Ownership
6 101 (3.96%) Public Cloud
7 92 (3.61%) Driving Licence
8 89 (3.49%) Cloud Native
9 88 (3.45%) Life Science
10 49 (1.92%) Algorithms
11 43 (1.69%) Blockchain
12 41 (1.61%) Data Centre
13 36 (1.41%) Mainframe
14 27 (1.06%) Distributed Systems
15 26 (1.02%) Blog
16 25 (0.98%) Hybrid Cloud
16 25 (0.98%) Reinsurance
17 24 (0.94%) Linux Command Line
17 24 (0.94%) Virtual Team
18 21 (0.82%) Social Media
Operating Systems
1 179 (7.02%) Linux
2 145 (5.68%) Windows
3 78 (3.06%) Windows Server
4 73 (2.86%) Unix
5 71 (2.78%) Android
6 11 (0.43%) Apple iOS
7 7 (0.27%) Windows 10
8 2 (0.078%) Mac OS
8 2 (0.078%) Solaris
8 2 (0.078%) VMS
8 2 (0.078%) Windows Server 2012
8 2 (0.078%) Windows Server 2016
Processes & Methodologies
1 730 (28.62%) Agile
2 500 (19.60%) Problem-Solving
3 332 (13.01%) Mentoring
4 306 (12.00%) DevOps
5 272 (10.66%) Project Delivery
6 268 (10.51%) Roadmaps
7 258 (10.11%) Software Engineering
8 237 (9.29%) Line Management
9 229 (8.98%) Project Management
10 183 (7.17%) Artificial Intelligence
11 176 (6.90%) Computer Science
12 169 (6.62%) Digital Engineering
13 167 (6.55%) Stakeholder Management
14 165 (6.47%) Scrum
15 162 (6.35%) CI/CD
15 162 (6.35%) Continuous Integration
16 160 (6.27%) Analytics
17 158 (6.19%) Infrastructure as Code
18 156 (6.12%) Creative Thinking
19 154 (6.04%) Cybersecurity
Programming Languages
1 394 (15.44%) Python
2 200 (7.84%) JavaScript
3 193 (7.57%) Java
4 190 (7.45%) SQL
5 152 (5.96%) PowerShell
6 99 (3.88%) C#
7 83 (3.25%) SAS Macro
8 74 (2.90%) Bash
9 69 (2.70%) C
10 54 (2.12%) TypeScript
11 51 (2.00%) C++
12 49 (1.92%) R
13 40 (1.57%) Rust
14 30 (1.18%) Go
15 16 (0.63%) T-SQL
16 14 (0.55%) Groovy
17 12 (0.47%) PHP
18 10 (0.39%) Perl
19 9 (0.35%) Data Analysis Expressions
19 9 (0.35%) Tcl
Qualifications
1 648 (25.40%) Degree
2 511 (20.03%) Security Cleared
3 200 (7.84%) SC Cleared
4 159 (6.23%) DV Cleared
5 100 (3.92%) Cisco Certification
6 73 (2.86%) Postgraduate
7 70 (2.74%) BPSS Clearance
8 68 (2.67%) AWS Certification
9 65 (2.55%) ACCA
10 57 (2.23%) Computer Science Degree
11 53 (2.08%) AWS Certified Solutions Architect
12 45 (1.76%) Numerate Degree
13 43 (1.69%) Azure Certification
14 42 (1.65%) DBS Check
15 41 (1.61%) Master's Degree
16 36 (1.41%) Microsoft Certification
17 35 (1.37%) CCNP
18 24 (0.94%) CCNA
19 23 (0.90%) AWS Certified Cloud Practitioner
19 23 (0.90%) AWS Certified Developer
Quality Assurance & Compliance
1 223 (8.74%) QA
2 83 (3.25%) CDISC
3 55 (2.16%) Data Quality
4 54 (2.12%) Accessibility
5 38 (1.49%) ISO/IEC 27001
6 33 (1.29%) GDPR
7 28 (1.10%) SLA
8 26 (1.02%) NIST
9 19 (0.74%) PMO
10 17 (0.67%) GAAP
11 16 (0.63%) GMP
11 16 (0.63%) Sarbanes-Oxley
12 15 (0.59%) GRC
12 15 (0.59%) IFRS
13 14 (0.55%) PCI DSS
14 12 (0.47%) ISO 9001
15 11 (0.43%) Cyber Essentials
16 10 (0.39%) NCSC
17 9 (0.35%) Good Clinical Practice
17 9 (0.35%) HIPAA
System Software
1 150 (5.88%) Active Directory
2 121 (4.74%) Docker
3 55 (2.16%) VMware Infrastructure
4 29 (1.14%) Virtual Machines
5 22 (0.86%) IAG
6 9 (0.35%) Virtual Desktop
7 6 (0.24%) vSphere
8 4 (0.16%) Hyper-V
8 4 (0.16%) XenApp
8 4 (0.16%) XenDesktop
9 3 (0.12%) SRDF
9 3 (0.12%) vCloud
9 3 (0.12%) VMware ESXi
9 3 (0.12%) VMware NSX
10 2 (0.078%) BitLocker
10 2 (0.078%) Firmware
11 1 (0.039%) HDFS
11 1 (0.039%) Terminal Server
Systems Management
1 236 (9.25%) Terraform
2 197 (7.72%) Kubernetes
3 121 (4.74%) Ansible
4 67 (2.63%) Puppet
5 41 (1.61%) Microsoft Intune
6 25 (0.98%) SCCM
7 19 (0.74%) HP Quality Center
8 14 (0.55%) Single Sign-On
9 12 (0.47%) AirWatch
9 12 (0.47%) Cisco CUCM
9 12 (0.47%) Cisco Prime
9 12 (0.47%) Cisco UCCX
10 9 (0.35%) Active Directory Federation Services
10 9 (0.35%) SCOM
11 8 (0.31%) Istio
11 8 (0.31%) Progress Chef
12 6 (0.24%) Consul
13 5 (0.20%) Fortio
13 5 (0.20%) Kiali
13 5 (0.20%) Prometheus
Vendors
1 338 (13.25%) Microsoft
2 144 (5.64%) Oracle
3 113 (4.43%) Cisco
4 112 (4.39%) SAP
5 95 (3.72%) Google
6 87 (3.41%) Citrix
7 69 (2.70%) VMware
8 46 (1.80%) Juniper
9 39 (1.53%) SolarWinds
10 31 (1.22%) Palo Alto
11 30 (1.18%) Salesforce
11 30 (1.18%) Virgin Media
12 28 (1.10%) ServiceNow
13 27 (1.06%) Sun
14 25 (0.98%) Databricks
15 18 (0.71%) HP
15 18 (0.71%) Qualtrics
16 15 (0.59%) Adobe
16 15 (0.59%) Veeam
17 13 (0.51%) Talend