Active Directory Jobs in the Thames Valley

Microsoft Active Directory
South East > Thames Valley

The table below provides summary statistics for permanent job vacancies advertised in the Thames Valley requiring Active Directory skills. It includes a benchmarking guide to the annual salaries offered in vacancies that cited Active Directory over the 6 months leading up to 23 May 2025, comparing them to the same period in the previous two years.

6 months to
23 May 2025
Same period 2024 Same period 2023
Rank 74 31 31
Rank change year-on-year -43 0 +27
Permanent jobs citing Active Directory 117 442 428
As % of all permanent jobs advertised in the Thames Valley 3.47% 6.56% 7.30%
As % of the System Software category 39.26% 44.78% 42.71%
Number of salaries quoted 88 398 362
10th Percentile £27,313 £26,250 £24,050
25th Percentile £31,250 £31,250 £27,500
Median annual salary (50th Percentile) £40,250 £40,000 £32,500
Median % change year-on-year +0.63% +23.08% -7.14%
75th Percentile £57,500 £55,000 £47,500
90th Percentile £76,275 £59,000 £60,000
South East median annual salary £40,000 £37,500 £35,000
% change year-on-year +6.67% +7.14% -

All System Software Skills
Thames Valley

Active Directory falls under the System Software category. For comparison with the information above, the following table provides summary statistics for all permanent job vacancies requiring system software skills in the Thames Valley.

Permanent vacancies with a requirement for system software skills 298 987 1,002
As % of all permanent jobs advertised in the Thames Valley 8.85% 14.64% 17.10%
Number of salaries quoted 196 790 635
10th Percentile £29,125 £28,950 £25,000
25th Percentile £37,250 £35,750 £30,500
Median annual salary (50th Percentile) £55,000 £50,000 £45,000
Median % change year-on-year +10.00% +11.11% -9.09%
75th Percentile £77,500 £69,688 £68,125
90th Percentile £83,750 £85,000 £87,500
South East median annual salary £52,500 £47,500 £47,500
% change year-on-year +10.53% - -5.00%

Active Directory
Job Vacancy Trend in the Thames Valley

Job postings citing Active Directory as a proportion of all IT jobs advertised in the Thames Valley.
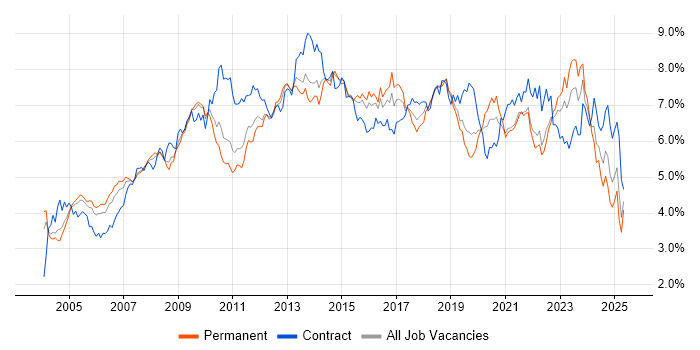
Job vacancy trend for Active Directory in the Thames Valley

Active Directory
Salary Trend in the Thames Valley

3-month moving average salary quoted in jobs citing Active Directory in the Thames Valley.

Salary trend for Active Directory in the Thames Valley

Active Directory
Salary Histogram in the Thames Valley

Salary distribution for jobs citing Active Directory in the Thames Valley over the 6 months to 23 May 2025.

Salary histogram for Active Directory in the Thames Valley

Active Directory
Job Locations in the Thames Valley

The table below looks at the demand and provides a guide to the median salaries quoted in IT jobs citing Active Directory within the Thames Valley region over the 6 months to 23 May 2025. The 'Rank Change' column provides an indication of the change in demand within each location based on the same 6 month period last year.

Location Rank Change
on Same Period
Last Year
Matching
Permanent
IT Job Ads
Median Salary
Past 6 Months
Median Salary
% Change
on Same Period
Last Year
Live
Jobs
Berkshire -42 58 £37,500 -23.35% 155
Oxfordshire -15 31 £40,250 +0.63% 49
Buckinghamshire -23 28 £45,000 +18.42% 79
Active Directory
South East

Active Directory
Co-occurring Skills and Capabilities in the Thames Valley by Category

The follow tables expand on the table above by listing co-occurrences grouped by category. The same employment type, locality and period is covered with up to 20 co-occurrences shown in each of the following categories:

Application Platforms
1 43 (36.75%) Microsoft Exchange
2 20 (17.09%) SharePoint
3 6 (5.13%) IBM Domino
4 3 (2.56%) IIS
5 1 (0.85%) Exchange Server 2003
5 1 (0.85%) Exchange Server 2007
5 1 (0.85%) Exchange Server 2010
5 1 (0.85%) Exchange Server 2013
Applications
1 12 (10.26%) Microsoft Office
2 4 (3.42%) Mozilla Thunderbird
Business Applications
1 4 (3.42%) SAP Business One
2 1 (0.85%) Sage 200
2 1 (0.85%) SAP ERP
Cloud Services
1 73 (62.39%) Azure
2 69 (58.97%) Microsoft 365
3 33 (28.21%) Entra ID
4 21 (17.95%) AWS
5 10 (8.55%) GCP
6 8 (6.84%) Serverless
7 6 (5.13%) IaaS
8 5 (4.27%) Azure Monitor
9 4 (3.42%) Amazon ECS
9 4 (3.42%) Amazon GuardDuty
9 4 (3.42%) Amazon S3
9 4 (3.42%) AWS KMS
9 4 (3.42%) AWS Lambda
9 4 (3.42%) Azure Cosmos DB
9 4 (3.42%) Azure Data Factory
9 4 (3.42%) Azure Functions
9 4 (3.42%) Virtual Private Cloud
10 3 (2.56%) Mimecast
11 2 (1.71%) OneDrive
11 2 (1.71%) Power Platform
Communications & Networking
1 42 (35.90%) DNS
2 40 (34.19%) DHCP
3 34 (29.06%) Firewall
4 19 (16.24%) TCP/IP
5 15 (12.82%) WAN
6 13 (11.11%) VLAN
7 12 (10.26%) LAN
8 11 (9.40%) VPN
9 9 (7.69%) Wi-Fi
10 8 (6.84%) VoIP
11 7 (5.98%) Remote Desktop
11 7 (5.98%) SAN
12 6 (5.13%) Cisco IOS
12 6 (5.13%) IP Telephony
13 5 (4.27%) Network Security
14 4 (3.42%) SMTP
14 4 (3.42%) SSL
14 4 (3.42%) Wireless
15 3 (2.56%) SD-WAN
16 2 (1.71%) WLAN
Database & Business Intelligence
1 18 (15.38%) SQL Server
2 7 (5.98%) Amazon RDS
3 3 (2.56%) NoSQL
4 2 (1.71%) Power BI
5 1 (0.85%) MySQL
5 1 (0.85%) PostgreSQL
Development Applications
1 4 (3.42%) Bitbucket Server
1 4 (3.42%) Jenkins
2 3 (2.56%) Git
3 1 (0.85%) Selenium
3 1 (0.85%) Visual Studio
General
1 40 (34.19%) Social Skills
2 8 (6.84%) Analytical Skills
3 5 (4.27%) Finance
4 3 (2.56%) Inclusion and Diversity
5 1 (0.85%) Banking
5 1 (0.85%) Legal
5 1 (0.85%) Manufacturing
5 1 (0.85%) Organisational Skills
5 1 (0.85%) Presentation Skills
5 1 (0.85%) Public Sector
5 1 (0.85%) Retail
5 1 (0.85%) Telecoms
Job Titles
1 37 (31.62%) Support Engineer
2 19 (16.24%) IT Support
3 18 (15.38%) IT Engineer
4 15 (12.82%) IT Support Engineer
5 14 (11.97%) Infrastructure Engineer
6 11 (9.40%) Senior
6 11 (9.40%) Technical Support
7 9 (7.69%) Platform Engineer
8 7 (5.98%) 2nd Line Support
8 7 (5.98%) IT Manager
8 7 (5.98%) Platform Support Engineer
8 7 (5.98%) Support Technician
8 7 (5.98%) Technical Engineer
9 6 (5.13%) Desktop Support
9 6 (5.13%) Infrastructure Support
9 6 (5.13%) Lead
10 5 (4.27%) Azure Developer
10 5 (4.27%) Desktop Engineer
10 5 (4.27%) Help Desk Engineer
10 5 (4.27%) Technology Specialist
Libraries, Frameworks & Software Standards
1 5 (4.27%) SAML
2 3 (2.56%) React
3 2 (1.71%) Node.js
4 1 (0.85%) .NET
4 1 (0.85%) AngularJS
4 1 (0.85%) CSS
4 1 (0.85%) HTML
4 1 (0.85%) JSON
Miscellaneous
1 10 (8.55%) Onboarding
2 8 (6.84%) PKI
3 7 (5.98%) Data Centre
4 6 (5.13%) Driving Licence
5 5 (4.27%) Greenfield Project
5 5 (4.27%) Management Information System
5 5 (4.27%) NHS
5 5 (4.27%) Video Conferencing
6 4 (3.42%) CCTV
6 4 (3.42%) Operational Technology
7 3 (2.56%) Clustering
7 3 (2.56%) Product Ownership
7 3 (2.56%) Replication
8 2 (1.71%) Enterprise Software
8 2 (1.71%) Security Posture
9 1 (0.85%) Cloud Native
9 1 (0.85%) Cyber Security Posture
9 1 (0.85%) Life Science
9 1 (0.85%) Public Cloud
9 1 (0.85%) Smartphone
Operating Systems
1 83 (70.94%) Windows
2 40 (34.19%) Windows Server
3 33 (28.21%) Mac OS
4 20 (17.09%) Windows 10
5 13 (11.11%) Linux
6 12 (10.26%) Android
7 6 (5.13%) Windows Server 2016
8 5 (4.27%) Apple iOS
8 5 (4.27%) Ubuntu
9 3 (2.56%) Mac OS X
9 3 (2.56%) Windows 7
10 2 (1.71%) Windows 8
10 2 (1.71%) Windows Server 2019
11 1 (0.85%) OpenBSD
11 1 (0.85%) Red Hat Enterprise Linux
11 1 (0.85%) Unix
11 1 (0.85%) VMS
11 1 (0.85%) Windows Server 2012
11 1 (0.85%) Windows Vista
11 1 (0.85%) Windows XP
Processes & Methodologies
1 46 (39.32%) Problem-Solving
2 33 (28.21%) Customer Service
3 26 (22.22%) Infrastructure Engineering
4 14 (11.97%) ITIL
5 12 (10.26%) Service Delivery
6 11 (9.40%) Cybersecurity
6 11 (9.40%) Project Management
7 10 (8.55%) DevOps
8 9 (7.69%) Agile
9 8 (6.84%) Identity Access Management
9 8 (6.84%) Platform Engineering
9 8 (6.84%) Server Management
10 7 (5.98%) Change Management
10 7 (5.98%) Disaster Recovery
10 7 (5.98%) Incident Management
10 7 (5.98%) Mentoring
11 6 (5.13%) Identity Management
11 6 (5.13%) ITSM
11 6 (5.13%) Problem Management
11 6 (5.13%) Root Cause Analysis
Programming Languages
1 22 (18.80%) PowerShell
2 10 (8.55%) Python
3 4 (3.42%) Shell Script
4 3 (2.56%) Bash
5 1 (0.85%) JavaScript
5 1 (0.85%) Korn
5 1 (0.85%) PHP
5 1 (0.85%) VBScript
Qualifications
1 23 (19.66%) Microsoft Certification
2 21 (17.95%) Degree
3 11 (9.40%) A+ Certification
4 10 (8.55%) MCP
5 9 (7.69%) Security Cleared
6 8 (6.84%) DBS Check
6 8 (6.84%) MCSA
7 7 (5.98%) Azure Certification
7 7 (5.98%) MCSE
7 7 (5.98%) SC Cleared
8 6 (5.13%) CCNA
8 6 (5.13%) Cisco Certification
8 6 (5.13%) VMware Certified Professional (VCP)
9 5 (4.27%) CCNP
10 4 (3.42%) Computer Science Degree
11 1 (0.85%) BPSS Clearance
11 1 (0.85%) CISSP
11 1 (0.85%) Network+ Certification
Quality Assurance & Compliance
1 7 (5.98%) SLA
2 6 (5.13%) ISO/IEC 27001
3 5 (4.27%) NIST
4 1 (0.85%) Actionable Recommendations
4 1 (0.85%) Cyber Essentials
4 1 (0.85%) Cyber Essentials PLUS
4 1 (0.85%) GDPR
4 1 (0.85%) HIPAA
4 1 (0.85%) ISO 22301
4 1 (0.85%) PCI DSS
System Software
1 36 (30.77%) Hyper-V
2 29 (24.79%) VMware Infrastructure
3 16 (13.68%) VMware ESXi
4 10 (8.55%) Virtual Machines
5 9 (7.69%) Docker
6 8 (6.84%) Virtual Desktop
7 6 (5.13%) Terminal Services
8 2 (1.71%) VMware Workstation
8 2 (1.71%) vSphere
9 1 (0.85%) Citrix Hypervisor
9 1 (0.85%) Microsoft Virtual Server
9 1 (0.85%) Virtual Servers
9 1 (0.85%) VMware NSX
Systems Management
1 10 (8.55%) Microsoft Intune
1 10 (8.55%) Terraform
2 9 (7.69%) vCenter Server
3 8 (6.84%) WSUS
4 7 (5.98%) Ansible
5 6 (5.13%) Single Sign-On
6 5 (4.27%) SCCM
7 4 (3.42%) Nessus
7 4 (3.42%) Proxmox
8 3 (2.56%) Failover Clustering
9 2 (1.71%) Kubernetes
9 2 (1.71%) ZENworks
10 1 (0.85%) FortiGate
10 1 (0.85%) PowerCLI
10 1 (0.85%) vRealize
10 1 (0.85%) VxRail
Vendors
1 92 (78.63%) Microsoft
2 38 (32.48%) VMware
3 18 (15.38%) Cisco
4 15 (12.82%) Apple
5 10 (8.55%) Google
6 8 (6.84%) Citrix
7 7 (5.98%) Sophos
8 6 (5.13%) Palo Alto
8 6 (5.13%) Ubiquiti
8 6 (5.13%) Veeam
9 5 (4.27%) Juniper
9 5 (4.27%) Meraki
10 4 (3.42%) SAP
11 3 (2.56%) ServiceNow
11 3 (2.56%) SolarWinds
11 3 (2.56%) SonicWALL
12 2 (1.71%) Dell
13 1 (0.85%) Draytek
13 1 (0.85%) HP
13 1 (0.85%) Red Hat