Software Engineering Jobs in the City of London

Software Engineering
Central London > City of London

The table below provides summary statistics for permanent job vacancies advertised in the City of London requiring Software Engineering skills. It includes a benchmarking guide to the annual salaries offered in vacancies that cited Software Engineering over the 6 months leading up to 29 May 2025, comparing them to the same period in the previous two years.

6 months to
29 May 2025
Same period 2024 Same period 2023
Rank 23 20 21
Rank change year-on-year -3 +1 -2
Permanent jobs citing Software Engineering 189 314 450
As % of all permanent jobs advertised in the City of London 9.86% 9.39% 9.94%
As % of the Processes & Methodologies category 10.24% 10.24% 10.44%
Number of salaries quoted 165 244 339
10th Percentile £56,250 £52,500 £48,750
25th Percentile £70,000 £65,000 £62,500
Median annual salary (50th Percentile) £85,000 £80,000 £90,000
Median % change year-on-year +6.25% -11.11% +2.86%
75th Percentile £110,000 £101,250 £111,250
90th Percentile £145,000 £113,750 £125,000
Central London median annual salary £87,500 £80,000 £86,250
% change year-on-year +9.38% -7.25% -1.43%

All Process and Methodology Skills
City of London

Software Engineering falls under the Processes and Methodologies category. For comparison with the information above, the following table provides summary statistics for all permanent job vacancies requiring process or methodology skills in the City of London.

Permanent vacancies with a requirement for process or methodology skills 1,845 3,067 4,311
As % of all permanent jobs advertised in the City of London 96.24% 91.69% 95.23%
Number of salaries quoted 1,387 2,389 3,587
10th Percentile £42,300 £41,315 £42,750
25th Percentile £53,750 £55,000 £56,250
Median annual salary (50th Percentile) £75,000 £75,000 £75,000
Median % change year-on-year - - +3.45%
75th Percentile £97,500 £95,000 £100,000
90th Percentile £122,500 £112,500 £115,000
Central London median annual salary £75,000 £72,500 £75,000
% change year-on-year +3.45% -3.33% +3.45%

Software Engineering
Job Vacancy Trend in the City of London

Job postings citing Software Engineering as a proportion of all IT jobs advertised in the City of London.
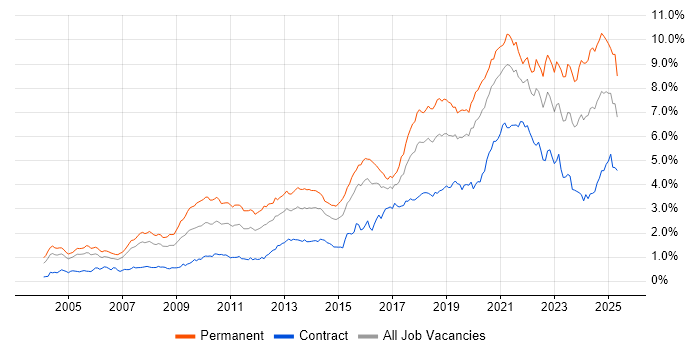
Job vacancy trend for Software Engineering in the City of London

Software Engineering
Salary Trend in the City of London

3-month moving average salary quoted in jobs citing Software Engineering in the City of London.

Salary trend for Software Engineering in the City of London

Software Engineering
Salary Histogram in the City of London

Salary distribution for jobs citing Software Engineering in the City of London over the 6 months to 29 May 2025.

Salary histogram for Software Engineering in the City of London

Software Engineering
Co-occurring Skills and Capabilities in the City of London by Category

The follow tables expand on the table above by listing co-occurrences grouped by category. The same employment type, locality and period is covered with up to 20 co-occurrences shown in each of the following categories:

Application Platforms
1 20 (10.58%) Apache Spark
2 3 (1.59%) Apache
2 3 (1.59%) Apache Airflow
2 3 (1.59%) Confluence
3 2 (1.06%) Kinematics
3 2 (1.06%) Liferay
4 1 (0.53%) CMS
4 1 (0.53%) Ethereum
4 1 (0.53%) IIS
4 1 (0.53%) NServiceBus
4 1 (0.53%) SharePoint
4 1 (0.53%) Solana
4 1 (0.53%) WordPress
Applications
1 2 (1.06%) Chatbot
2 1 (0.53%) Adobe XD
2 1 (0.53%) Blender
2 1 (0.53%) Maya
2 1 (0.53%) Microsoft Office
Business Applications
1 2 (1.06%) Payment Gateway
2 1 (0.53%) Elite 3E
Cloud Services
1 72 (38.10%) AWS
2 49 (25.93%) Azure
3 33 (17.46%) SaaS
4 11 (5.82%) GCP
5 10 (5.29%) Serverless
6 9 (4.76%) GitHub
7 7 (3.70%) Amazon ECS
8 5 (2.65%) AWS CloudFormation
8 5 (2.65%) AWS Lambda
8 5 (2.65%) Azure Data Factory
8 5 (2.65%) Cloud Computing
8 5 (2.65%) Power Platform
9 4 (2.12%) Amazon EKS
9 4 (2.12%) Azure DevOps
10 3 (1.59%) Amazon CloudWatch
10 3 (1.59%) Virtual Private Cloud
11 2 (1.06%) Amazon S3
11 2 (1.06%) Amazon SQS
11 2 (1.06%) Power Automate
11 2 (1.06%) PowerApps
Communications & Networking
1 16 (8.47%) HTTP
2 3 (1.59%) Multicast
3 1 (0.53%) Broadband
Database & Business Intelligence
1 34 (17.99%) PostgreSQL
2 16 (8.47%) MongoDB
3 8 (4.23%) SQL Server
4 7 (3.70%) NoSQL
5 6 (3.17%) Azure SQL Database
6 3 (1.59%) Amazon Athena
6 3 (1.59%) Data Lake
6 3 (1.59%) DynamoDB
6 3 (1.59%) Elasticsearch
6 3 (1.59%) Neo4j
6 3 (1.59%) Power BI
6 3 (1.59%) Tableau
7 2 (1.06%) OLAP
7 2 (1.06%) OLTP
7 2 (1.06%) Redis
7 2 (1.06%) Relational Database
8 1 (0.53%) Amazon RDS
8 1 (0.53%) Data Warehouse
8 1 (0.53%) Flink
8 1 (0.53%) SQL Server Reporting Services
Development Applications
1 12 (6.35%) Git
2 8 (4.23%) JIRA
3 2 (1.06%) Artifactory
3 2 (1.06%) Jenkins
3 2 (1.06%) JUnit
3 2 (1.06%) Octopus Deploy
4 1 (0.53%) Babel
4 1 (0.53%) Eclipse
4 1 (0.53%) IDA Disassembler
4 1 (0.53%) Jasmine
4 1 (0.53%) Moq
4 1 (0.53%) Postman
4 1 (0.53%) SpecFlow
4 1 (0.53%) Visual Studio
4 1 (0.53%) webpack
General
1 56 (29.63%) Finance
2 42 (22.22%) Social Skills
3 28 (14.81%) Retail
4 22 (11.64%) Games
5 21 (11.11%) Inclusion and Diversity
6 18 (9.52%) Advertising
7 16 (8.47%) Banking
8 13 (6.88%) Analytical Skills
9 8 (4.23%) Front Office
10 4 (2.12%) Back Office
11 3 (1.59%) Public Sector
12 2 (1.06%) Agriculture
12 2 (1.06%) Investment Banking
12 2 (1.06%) Marketing
13 1 (0.53%) Automotive
13 1 (0.53%) Financial Institution
13 1 (0.53%) Law
13 1 (0.53%) Legal
13 1 (0.53%) Organisational Skills
13 1 (0.53%) Pharmaceutical
Job Titles
1 81 (42.86%) Software Engineer
2 69 (36.51%) Senior
3 51 (26.98%) Senior Software Engineer
4 29 (15.34%) Developer
5 20 (10.58%) Full-Stack Engineer
6 18 (9.52%) Lead
7 14 (7.41%) Senior Developer
8 10 (5.29%) Python Engineer
8 10 (5.29%) Python Software Engineer
9 9 (4.76%) Java Engineer
9 9 (4.76%) Java Software Engineer
10 8 (4.23%) AWS Engineer
11 7 (3.70%) .NET Developer
11 7 (3.70%) AWS Software Engineer
11 7 (3.70%) Head of Engineering
11 7 (3.70%) Software Developer
12 6 (3.17%) Engineering Manager
12 6 (3.17%) Lead Developer
12 6 (3.17%) Principal Engineer
12 6 (3.17%) Principal Software Engineer
Libraries, Frameworks & Software Standards
1 54 (28.57%) React
2 36 (19.05%) Node.js
3 32 (16.93%) REST
4 23 (12.17%) Kafka
5 21 (11.11%) .NET
5 21 (11.11%) Django
6 15 (7.94%) Next.js
7 14 (7.41%) HTML
8 13 (6.88%) CSS
9 11 (5.82%) AngularJS
10 10 (5.29%) Web Services
11 9 (4.76%) RESTful
12 6 (3.17%) .NET Framework
12 6 (3.17%) Entity Framework
12 6 (3.17%) OAuth
13 5 (2.65%) OAuth2
13 5 (2.65%) Pandas
13 5 (2.65%) Spring
14 4 (2.12%) .NET Core
14 4 (2.12%) FastAPI
Miscellaneous
1 22 (11.64%) Distributed Systems
2 16 (8.47%) Cloud Native
3 14 (7.41%) Algorithms
4 10 (5.29%) Product Ownership
5 7 (3.70%) Greenfield Project
6 6 (3.17%) Enterprise Software
6 6 (3.17%) Reinsurance
7 5 (2.65%) Fixed Income
7 5 (2.65%) Foreign Exchange (FX)
7 5 (2.65%) Robotics
8 4 (2.12%) Cyberattack
8 4 (2.12%) Management Information System
9 3 (1.59%) Data Structures
9 3 (1.59%) Derivative
10 2 (1.06%) Blockchain
10 2 (1.06%) Legacy Systems
10 2 (1.06%) Low-Code
10 2 (1.06%) Onboarding
11 1 (0.53%) Educational Technology
11 1 (0.53%) Team-Oriented Environment
Operating Systems
1 8 (4.23%) Linux
2 5 (2.65%) Robot Operating System
3 3 (1.59%) Android
4 1 (0.53%) VMS
4 1 (0.53%) Windows
4 1 (0.53%) Windows Server
Processes & Methodologies
1 75 (39.68%) Agile
2 43 (22.75%) Problem-Solving
3 41 (21.69%) Roadmaps
4 40 (21.16%) Computer Science
5 36 (19.05%) DevOps
6 34 (17.99%) Full-Stack Development
7 33 (17.46%) Mentoring
8 31 (16.40%) CI/CD
9 28 (14.81%) Microservices
10 26 (13.76%) Machine Learning
11 25 (13.23%) Containerisation
12 21 (11.11%) Artificial Intelligence
13 20 (10.58%) TDD
14 19 (10.05%) Product Roadmap
15 17 (8.99%) Performance Metrics
16 16 (8.47%) Infrastructure as Code
16 16 (8.47%) Programmatic Advertising
17 15 (7.94%) Analytics
18 13 (6.88%) Technology Roadmap
19 12 (6.35%) Technical Leadership
Programming Languages
1 108 (57.14%) Python
2 61 (32.28%) TypeScript
3 36 (19.05%) Java
4 34 (17.99%) JavaScript
5 30 (15.87%) SQL
6 29 (15.34%) C#
7 19 (10.05%) Scala
8 12 (6.35%) C++
9 10 (5.29%) Go
10 7 (3.70%) PHP
10 7 (3.70%) Rust
11 3 (1.59%) Kotlin
12 2 (1.06%) Bicep
12 2 (1.06%) MATLAB
12 2 (1.06%) PL/SQL
12 2 (1.06%) PowerShell
13 1 (0.53%) Apex Code
13 1 (0.53%) Bash
13 1 (0.53%) SOQL
13 1 (0.53%) VB.NET
Qualifications
1 42 (22.22%) Degree
2 11 (5.82%) Computer Science Degree
3 8 (4.23%) Master's Degree
4 4 (2.12%) DV Cleared
4 4 (2.12%) Security Cleared
5 3 (1.59%) Numerate Degree
6 1 (0.53%) ITIL Certification
6 1 (0.53%) PhD
Quality Assurance & Compliance
1 13 (6.88%) QA
2 4 (2.12%) Accessibility
3 2 (1.06%) GDPR
3 2 (1.06%) PCI DSS
3 2 (1.06%) SLA
3 2 (1.06%) Software Quality Assurance
4 1 (0.53%) CDISC
4 1 (0.53%) Data Quality
System Software
1 24 (12.70%) Docker
2 3 (1.59%) Active Directory
Systems Management
1 30 (15.87%) Kubernetes
2 19 (10.05%) Terraform
3 5 (2.65%) Ansible
4 1 (0.53%) Progress Chef
Vendors
1 27 (14.29%) Google
1 27 (14.29%) Microsoft
2 16 (8.47%) Apple
3 9 (4.76%) Ping Identity
4 3 (1.59%) Oracle
5 2 (1.06%) Databricks
5 2 (1.06%) OpenAI
5 2 (1.06%) Salesforce
6 1 (0.53%) Aderant
6 1 (0.53%) Adobe
6 1 (0.53%) IBM
6 1 (0.53%) Intapp
6 1 (0.53%) ServiceNow