Performance Attribution Jobs in London

Performance Attribution
England > London

The following table provides summary statistics for permanent job vacancies advertised in London with a requirement for Performance Attribution skills. Included is a benchmarking guide to the salaries offered in vacancies that have cited Performance Attribution over the 6 months to 3 May 2024 with a comparison to the same period in the previous 2 years.

6 months to
3 May 2024
Same period 2023 Same period 2022
Rank 462 541 786
Rank change year-on-year +79 +245 -206
Permanent jobs citing Performance Attribution 40 82 101
As % of all permanent jobs advertised in London 0.17% 0.23% 0.15%
As % of the Processes & Methodologies category 0.19% 0.24% 0.16%
Number of salaries quoted 39 79 88
10th Percentile £85,250 £75,000 £77,500
25th Percentile £87,500 £91,250 £107,500
Median annual salary (50th Percentile) £110,000 £107,500 £125,000
Median % change year-on-year +2.33% -14.00% +38.89%
75th Percentile £140,000 £143,750 £162,500
90th Percentile £143,750 £151,250 £192,500
England median annual salary £110,000 £107,500 £125,000
% change year-on-year +2.33% -14.00% +38.89%

All Process and Methodology Skills
London

Performance Attribution is in the Processes and Methodologies category. The following table is for comparison with the above and provides summary statistics for all permanent job vacancies advertised in London with a requirement for process or methodology skills.

Permanent vacancies with a requirement for process or methodology skills 21,582 33,665 64,692
As % of all permanent jobs advertised in London 91.32% 95.35% 96.86%
Number of salaries quoted 16,066 24,126 34,397
10th Percentile £38,000 £43,465 £42,500
25th Percentile £52,000 £55,000 £53,750
Median annual salary (50th Percentile) £70,000 £75,000 £70,000
Median % change year-on-year -6.67% +7.14% -
75th Percentile £95,000 £95,000 £92,500
90th Percentile £115,000 £115,000 £111,250
England median annual salary £55,000 £62,500 £60,000
% change year-on-year -12.00% +4.17% +9.09%

Performance Attribution
Job Vacancy Trend in London

Job postings citing Performance Attribution as a proportion of all IT jobs advertised in London.
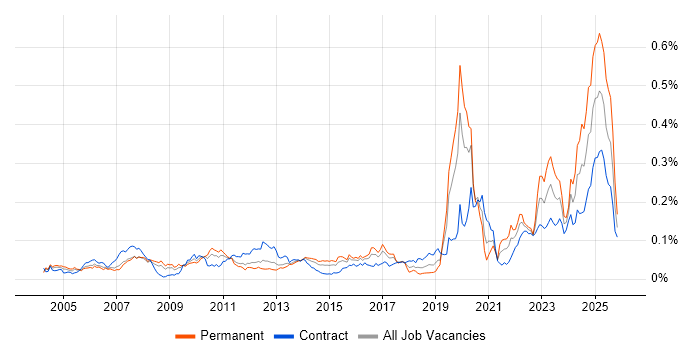
Job vacancy trend for Performance Attribution in London

Performance Attribution
Salary Trend in London

3-month moving average salary quoted in jobs citing Performance Attribution in London.

Salary trend for Performance Attribution in London

Performance Attribution
Salary Histogram in London

Salary distribution for jobs citing Performance Attribution in London over the 6 months to 3 May 2024.

Salary histogram for Performance Attribution in London

Performance Attribution
Co-occurring Skills and Capabilities in London by Category

The follow tables expand on the table above by listing co-occurrences grouped by category. The same employment type, locality and period is covered with up to 20 co-occurrences shown in each of the following categories:

Application Platforms
1 20 (50.00%) Apache
1 20 (50.00%) Apache Airflow
2 1 (2.50%) Apache Pulsar
2 1 (2.50%) Oracle SOA Suite
Cloud Services
1 39 (97.50%) AWS
2 38 (95.00%) GCP
3 10 (25.00%) dbt
4 1 (2.50%) Azure
4 1 (2.50%) npm
4 1 (2.50%) Yarn
Database & Business Intelligence
1 20 (50.00%) Apache Ignite
2 10 (25.00%) Amazon Athena
2 10 (25.00%) Apache Arrow
2 10 (25.00%) Dremio
3 1 (2.50%) MongoDB
3 1 (2.50%) Relational Database
3 1 (2.50%) SQL Server
Development Applications
1 1 (2.50%) Ant
1 1 (2.50%) Eclipse
1 1 (2.50%) Git
1 1 (2.50%) IntelliJ
1 1 (2.50%) Jenkins
1 1 (2.50%) Maven
1 1 (2.50%) Mercurial
1 1 (2.50%) SonarQube
1 1 (2.50%) Team Foundation Server
1 1 (2.50%) Visual Studio Code
General
1 38 (95.00%) Finance
1 38 (95.00%) Front Office
2 1 (2.50%) Back Office
Job Titles
1 40 (100.00%) Developer
2 38 (95.00%) Developer/Software Engineer
2 38 (95.00%) Software Engineer
3 28 (70.00%) React Developer
4 19 (47.50%) Full Stack Developer
5 18 (45.00%) Full Stack Engineer
5 18 (45.00%) Full Stack Software Engineer
6 10 (25.00%) AWS Developer
6 10 (25.00%) AWS Engineer
6 10 (25.00%) AWS Software Engineer
6 10 (25.00%) Front-End Developer (Client-Side Developer)
6 10 (25.00%) Front-End Engineer (Client-Side Engineer)
6 10 (25.00%) Python Developer
6 10 (25.00%) Python Engineer
6 10 (25.00%) Python Software Engineer
6 10 (25.00%) UI Developer
6 10 (25.00%) UI Engineer
7 1 (2.50%) Quantitative Developer
7 1 (2.50%) Senior Developer
7 1 (2.50%) Senior Full Stack Developer
Libraries, Frameworks & Software Standards
1 39 (97.50%) Node.js
1 39 (97.50%) React
2 38 (95.00%) Redux
3 20 (50.00%) gRPC
3 20 (50.00%) Protocol Buffers
4 18 (45.00%) GraphQL
4 18 (45.00%) Material-UI
5 11 (27.50%) AngularJS
5 11 (27.50%) NumPy
5 11 (27.50%) Pandas
5 11 (27.50%) SciPy
6 10 (25.00%) Vue
7 1 (2.50%) Express.js
7 1 (2.50%) Kafka
7 1 (2.50%) MEAN Stack
7 1 (2.50%) MERN Stack
7 1 (2.50%) RESTful
Miscellaneous
1 38 (95.00%) Fixed Income
2 1 (2.50%) Equities
2 1 (2.50%) Foreign Exchange (FX)
2 1 (2.50%) Hedge funds
2 1 (2.50%) Virtual Team
Operating Systems
1 1 (2.50%) Linux
1 1 (2.50%) Solaris
1 1 (2.50%) Unix
Processes & Methodologies
1 39 (97.50%) Agile
2 38 (95.00%) Asset Management
2 38 (95.00%) Fintech
2 38 (95.00%) Investment Management
2 38 (95.00%) Software Engineering
3 29 (72.50%) Full Stack Development
4 19 (47.50%) Analytics
5 18 (45.00%) Risk Analytics
6 10 (25.00%) Credit Risk Analysis
6 10 (25.00%) Front End Development
6 10 (25.00%) User Experience
7 1 (2.50%) Architectural Patterns
7 1 (2.50%) Automated Trading
7 1 (2.50%) Backtesting
7 1 (2.50%) Data Engineering
7 1 (2.50%) Data Pipeline
7 1 (2.50%) Data Reconciliation
7 1 (2.50%) Microservices
7 1 (2.50%) Proprietary Trading
7 1 (2.50%) TDD
Programming Languages
1 39 (97.50%) JavaScript
1 39 (97.50%) Python
1 39 (97.50%) TypeScript
2 19 (47.50%) Java
3 18 (45.00%) Kotlin
4 1 (2.50%) C
4 1 (2.50%) C++
4 1 (2.50%) SQL
System Software
1 1 (2.50%) Docker
Systems Management
1 1 (2.50%) Hadoop YARN
1 1 (2.50%) Kubernetes
Vendors
1 1 (2.50%) Oracle
1 1 (2.50%) Sybase