Analytics Jobs in London

Analytics
England > London

The table below provides summary statistics for permanent job vacancies advertised in London requiring Analytics skills. It includes a benchmarking guide to the annual salaries offered in vacancies that cited Analytics over the 6 months leading up to 26 July 2024, comparing them to the same period in the previous two years.

6 months to
26 Jul 2024
Same period 2023 Same period 2022
Rank 20 21 18
Rank change year-on-year +1 -3 +4
Permanent jobs citing Analytics 1,893 2,561 10,018
As % of all permanent jobs advertised in London 9.13% 9.44% 13.35%
As % of the Processes & Methodologies category 10.21% 9.96% 13.76%
Number of salaries quoted 1,104 1,844 3,755
10th Percentile £42,500 £46,250 £42,500
25th Percentile £55,000 £58,664 £53,125
Median annual salary (50th Percentile) £77,500 £77,500 £75,000
Median % change year-on-year - +3.33% +7.14%
75th Percentile £104,063 £100,000 £97,270
90th Percentile £122,500 £130,000 £122,500
England median annual salary £60,319 £65,000 £65,000
% change year-on-year -7.20% - +8.33%

All Process and Methodology Skills
London

Analytics falls under the Processes and Methodologies category. For comparison with the information above, the following table provides summary statistics for all permanent job vacancies requiring process or methodology skills in London.

Permanent vacancies with a requirement for process or methodology skills 18,545 25,706 72,795
As % of all permanent jobs advertised in London 89.42% 94.78% 97.04%
Number of salaries quoted 12,808 20,124 35,328
10th Percentile £39,500 £42,500 £42,500
25th Percentile £52,500 £55,000 £53,750
Median annual salary (50th Percentile) £72,500 £74,000 £70,000
Median % change year-on-year -2.03% +5.71% -
75th Percentile £95,000 £95,000 £91,732
90th Percentile £120,000 £116,250 £110,000
England median annual salary £55,000 £62,000 £60,000
% change year-on-year -11.29% +3.33% +4.35%

Analytics
Job Vacancy Trend in London

Job postings citing Analytics as a proportion of all IT jobs advertised in London.
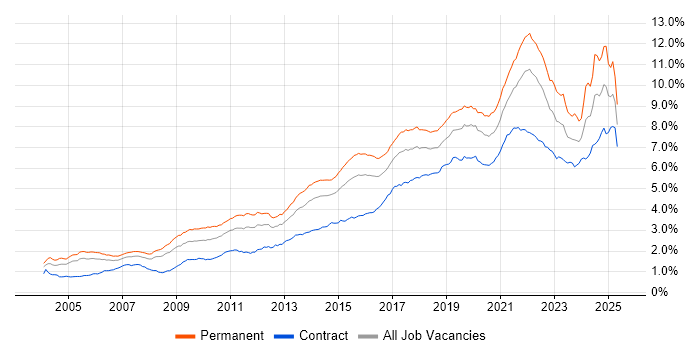
Job vacancy trend for Analytics in London

Analytics
Salary Trend in London

3-month moving average salary quoted in jobs citing Analytics in London.

Salary trend for Analytics in London

Analytics
Salary Histogram in London

Salary distribution for jobs citing Analytics in London over the 6 months to 26 July 2024.

Salary histogram for Analytics in London

Analytics
Job Locations in London

The table below looks at the demand and provides a guide to the median salaries quoted in IT jobs citing Analytics within the London region over the 6 months to 26 July 2024. The 'Rank Change' column provides an indication of the change in demand within each location based on the same 6 month period last year.

Location Rank Change
on Same Period
Last Year
Matching
Permanent
IT Job Ads
Median Salary
Past 6 Months
Median Salary
% Change
on Same Period
Last Year
Live
Jobs
Central London +21 370 £67,500 -10.00% 64
West London -12 91 £64,000 +38.38% 22
South London -7 45 £67,500 +68.75% 10
East London +21 2 £64,542 -22.94% 5
North London - 2 £40,000 - 2
Analytics
England

Analytics
Co-occurring Skills and Capabilities in London by Category

The follow tables expand on the table above by listing co-occurrences grouped by category. The same employment type, locality and period is covered with up to 20 co-occurrences shown in each of the following categories:

Application Platforms
1 74 (3.91%) Apache Airflow
2 68 (3.59%) Apache
3 53 (2.80%) SAS
4 50 (2.64%) Apache Spark
5 34 (1.80%) CMS
6 25 (1.32%) SharePoint
7 18 (0.95%) Confluence
8 8 (0.42%) IIS
9 6 (0.32%) WordPress
10 5 (0.26%) Adobe Experience Manager
10 5 (0.26%) Appian
11 4 (0.21%) Microsoft Exchange
12 3 (0.16%) IBM Notes
12 3 (0.16%) nginx
13 2 (0.11%) Ethereum
13 2 (0.11%) Moodle
14 1 (0.053%) DataSynapse
14 1 (0.053%) Headless CMS
14 1 (0.053%) Jupyter
14 1 (0.053%) Luigi
Applications
1 130 (6.87%) Microsoft Excel
2 48 (2.54%) Microsoft Office
3 41 (2.17%) Microsoft PowerPoint
4 13 (0.69%) SPSS
5 8 (0.42%) Spreadsheet
6 6 (0.32%) MS Visio
7 5 (0.26%) Adobe Creative Suite
7 5 (0.26%) Trello
8 4 (0.21%) Microsoft Project
9 3 (0.16%) AutoCAD
9 3 (0.16%) Chatbot
9 3 (0.16%) Photoshop
10 2 (0.11%) InDesign
11 1 (0.053%) Adobe Illustrator
11 1 (0.053%) Adobe Premiere
11 1 (0.053%) Revit
Business Applications
1 14 (0.74%) Unit4 Business World
2 12 (0.63%) Aladdin
2 12 (0.63%) Remedy ITSM
3 9 (0.48%) IBM Planning Analytics
4 8 (0.42%) Dynamics CRM
4 8 (0.42%) Shopify
5 6 (0.32%) Oracle General Ledger
5 6 (0.32%) Oracle Subledger Accounting
6 5 (0.26%) SAP BPC
7 4 (0.21%) Oracle Payroll
7 4 (0.21%) SAP S/4HANA
8 3 (0.16%) Magento
8 3 (0.16%) Relativity
8 3 (0.16%) Salesforce CRM
8 3 (0.16%) SAP CO
8 3 (0.16%) SAP FI
8 3 (0.16%) SAP FI/CO
9 2 (0.11%) MIS ActiveH
9 2 (0.11%) NEC Housing
9 2 (0.11%) Veritas eDiscovery
Cloud Services
1 507 (26.78%) AWS
2 405 (21.39%) Azure
3 309 (16.32%) Power Platform
4 203 (10.72%) GCP
5 120 (6.34%) dbt
6 94 (4.97%) Azure Data Factory
7 90 (4.75%) Azure Synapse Analytics
7 90 (4.75%) Google Analytics
8 59 (3.12%) Azure DevOps
9 58 (3.06%) Amazon S3
9 58 (3.06%) SaaS
10 41 (2.17%) Azure Monitor
11 37 (1.95%) Dagster
12 36 (1.90%) Serverless
13 34 (1.80%) Microsoft 365
14 33 (1.74%) Cloud Computing
15 32 (1.69%) Snowflake
16 31 (1.64%) PaaS
17 30 (1.58%) GitHub
18 25 (1.32%) AWS Lambda
Communications & Networking
1 107 (5.65%) Broadband
2 16 (0.85%) Network Security
3 11 (0.58%) Firewall
4 5 (0.26%) FTP
4 5 (0.26%) VPN
5 3 (0.16%) OpenVPN
5 3 (0.16%) Wireless
6 2 (0.11%) 5G
6 2 (0.11%) HTTP
6 2 (0.11%) SNA
6 2 (0.11%) TCP/IP
6 2 (0.11%) WAN
7 1 (0.053%) BGP
7 1 (0.053%) DNS
7 1 (0.053%) Internet
7 1 (0.053%) LAN
7 1 (0.053%) MPLS
7 1 (0.053%) SAN
7 1 (0.053%) SD-WAN
7 1 (0.053%) VPLS
Database & Business Intelligence
1 308 (16.27%) Tableau
2 302 (15.95%) Power BI
3 205 (10.83%) Data Warehouse
4 149 (7.87%) Data Lake
5 112 (5.92%) SQL Server
6 108 (5.71%) Big Data
7 77 (4.07%) Amazon Athena
8 76 (4.01%) Dremio
9 72 (3.80%) NoSQL
10 65 (3.43%) Azure SQL Database
11 62 (3.28%) Amazon Redshift
12 52 (2.75%) BigQuery
13 48 (2.54%) Amazon QuickSight
14 47 (2.48%) Apache Arrow
14 47 (2.48%) Relational Database
15 40 (2.11%) Data Mining
16 39 (2.06%) SQL Server Integration Services
17 37 (1.95%) Metadata
18 33 (1.74%) Looker
19 29 (1.53%) MongoDB
Development Applications
1 158 (8.35%) Git
2 39 (2.06%) JIRA
3 32 (1.69%) Jenkins
4 21 (1.11%) Visual Studio
5 9 (0.48%) Team Foundation Server
6 6 (0.32%) Crashlytics
6 6 (0.32%) RStudio
6 6 (0.32%) SoapUI
7 5 (0.26%) GitLab
7 5 (0.26%) SQL Server Management Studio (SSMS)
8 4 (0.21%) Burp Suite
8 4 (0.21%) CircleCI
8 4 (0.21%) Metasploit
8 4 (0.21%) Selenium
9 3 (0.16%) Visual Studio Code
10 2 (0.11%) Flyway
10 2 (0.11%) Hardhat
10 2 (0.11%) Liquibase
10 2 (0.11%) MLflow
10 2 (0.11%) Spinnaker
General
1 656 (34.65%) Social Skills
2 619 (32.70%) Finance
3 578 (30.53%) Analytical Skills
4 306 (16.16%) Marketing
5 228 (12.04%) Banking
6 212 (11.20%) Retail
7 207 (10.94%) Front Office
8 183 (9.67%) Presentation Skills
9 161 (8.51%) Inclusion and Diversity
10 133 (7.03%) Advertising
11 109 (5.76%) Law
12 92 (4.86%) Legal
13 83 (4.38%) Investment Banking
14 55 (2.91%) Pharmaceutical
15 49 (2.59%) Influencing Skills
16 47 (2.48%) Public Sector
17 36 (1.90%) Organisational Skills
18 24 (1.27%) Financial Institution
19 21 (1.11%) Publishing
20 17 (0.90%) Games
Job Titles
1 479 (25.30%) Analyst
2 437 (23.09%) Senior
3 262 (13.84%) Lead
4 195 (10.30%) Data Analyst
5 182 (9.61%) Developer
6 168 (8.87%) Data Engineer
7 143 (7.55%) Senior Analyst
8 108 (5.71%) Senior Data Analyst
9 107 (5.65%) Architect
10 84 (4.44%) Business Analyst
11 82 (4.33%) Senior Manager
12 74 (3.91%) Product Manager
13 71 (3.75%) Python Engineer
14 70 (3.70%) Data Manager
15 66 (3.49%) Software Engineer
16 60 (3.17%) Consultant
17 59 (3.12%) Data Scientist
18 58 (3.06%) Analytics Manager
19 51 (2.69%) Azure Engineer
19 51 (2.69%) Python Data Engineer
Libraries, Frameworks & Software Standards
1 97 (5.12%) .NET
2 91 (4.81%) React
3 82 (4.33%) Pandas
4 76 (4.01%) HTML
5 70 (3.70%) NumPy
6 68 (3.59%) PySpark
7 51 (2.69%) Kafka
7 51 (2.69%) SciPy
8 50 (2.64%) CSS
9 39 (2.06%) REST
10 33 (1.74%) AngularJS
11 29 (1.53%) .NET Core
12 28 (1.48%) .NET Framework
12 28 (1.48%) gRPC
12 28 (1.48%) XML
13 26 (1.37%) HTML5
13 26 (1.37%) Protocol Buffers
14 24 (1.27%) SOAP
15 22 (1.16%) PyTorch
15 22 (1.16%) TensorFlow
Miscellaneous
1 137 (7.24%) Fixed Income
2 130 (6.87%) Hedge funds
3 124 (6.55%) Product Ownership
4 117 (6.18%) Marketing Technology
5 116 (6.13%) Algorithms
6 109 (5.76%) Foreign Exchange (FX)
7 108 (5.71%) Equities
8 99 (5.23%) Derivative
9 90 (4.75%) Onboarding
10 65 (3.43%) Management Information System
11 64 (3.38%) Life Science
12 43 (2.27%) Data Structures
12 43 (2.27%) Social Media
13 37 (1.95%) Public Cloud
14 33 (1.74%) Distributed Systems
15 29 (1.53%) Cyberattack
16 24 (1.27%) Reinsurance
17 22 (1.16%) Greenfield Project
18 21 (1.11%) Analytical Mindset
18 21 (1.11%) Blog
Operating Systems
1 83 (4.38%) Windows
2 79 (4.17%) Linux
3 20 (1.06%) Unix
4 17 (0.90%) Android
5 16 (0.85%) Apple iOS
5 16 (0.85%) Windows Server
6 12 (0.63%) zOS
7 7 (0.37%) Mac OS
8 5 (0.26%) CentOS
9 4 (0.21%) Red Hat Enterprise Linux
9 4 (0.21%) VMS
10 1 (0.053%) Solaris
10 1 (0.053%) Windows 10
Processes & Methodologies
1 484 (25.57%) Agile
2 433 (22.87%) Visualisation
3 424 (22.40%) Problem-Solving
4 403 (21.29%) Data Analytics
5 392 (20.71%) Business Intelligence
6 288 (15.21%) Data Analysis
7 283 (14.95%) Statistics
8 267 (14.10%) Data Modelling
9 265 (14.00%) Data Science
10 247 (13.05%) Data Pipeline
11 243 (12.84%) Mathematics
12 239 (12.63%) Data Visualisation
13 228 (12.04%) Computer Science
14 227 (11.99%) Actionable Insight
15 226 (11.94%) ETL
15 226 (11.94%) Machine Learning
16 215 (11.36%) Roadmaps
17 213 (11.25%) Artificial Intelligence
17 213 (11.25%) Decision-Making
18 208 (10.99%) Software Engineering
Programming Languages
1 816 (43.11%) SQL
2 755 (39.88%) Python
3 161 (8.51%) Java
4 138 (7.29%) JavaScript
5 124 (6.55%) C#
6 103 (5.44%) R
7 65 (3.43%) TypeScript
8 57 (3.01%) PowerShell
9 37 (1.95%) Data Analysis Expressions
9 37 (1.95%) Scala
10 33 (1.74%) T-SQL
11 26 (1.37%) VBA
12 24 (1.27%) C++
12 24 (1.27%) MATLAB
13 18 (0.95%) Bash
13 18 (0.95%) Kotlin
14 17 (0.90%) Go
15 16 (0.85%) Ruby
16 11 (0.58%) PL/SQL
17 10 (0.53%) U-SQL
Qualifications
1 582 (30.74%) Degree
2 137 (7.24%) Master's Degree
3 136 (7.18%) DBS Check
4 79 (4.17%) Security Cleared
5 74 (3.91%) Computer Science Degree
6 63 (3.33%) PhD
7 41 (2.17%) Azure Certification
8 40 (2.11%) ACCA
9 29 (1.53%) SC Cleared
10 27 (1.43%) Microsoft Certification
11 24 (1.27%) DV Cleared
12 18 (0.95%) Numerate Degree
13 16 (0.85%) CISA
13 16 (0.85%) CISSP
14 11 (0.58%) MBA
15 10 (0.53%) MCP
15 10 (0.53%) Oracle Certification
16 8 (0.42%) CIMA
17 7 (0.37%) A+ Certification
18 5 (0.26%) BPSS Clearance
Quality Assurance & Compliance
1 183 (9.67%) Data Quality
2 59 (3.12%) QA
3 44 (2.32%) IFRS
4 25 (1.32%) Accessibility
5 23 (1.22%) IFRS 9
6 22 (1.16%) GDPR
7 17 (0.90%) ITGC
8 15 (0.79%) PMO
9 12 (0.63%) SLA
10 10 (0.53%) ISO/IEC 27001
11 8 (0.42%) SOC 2
12 7 (0.37%) HIPAA
12 7 (0.37%) MiFID
13 6 (0.32%) Actionable Recommendations
13 6 (0.32%) GAAP
13 6 (0.32%) NIST
14 4 (0.21%) California Consumer Privacy Act
14 4 (0.21%) ISO 9001
14 4 (0.21%) SOC 1
15 3 (0.16%) WCAG
System Software
1 49 (2.59%) Docker
2 22 (1.16%) Active Directory
3 12 (0.63%) Virtual Machines
4 5 (0.26%) vSphere
5 3 (0.16%) HDFS
5 3 (0.16%) Hyper-V
5 3 (0.16%) VMware Infrastructure
6 2 (0.11%) Firmware
7 1 (0.053%) Slurm Workload Manager
7 1 (0.053%) VirtualBox
Systems Management
1 54 (2.85%) Kubernetes
2 48 (2.54%) Terraform
3 8 (0.42%) Microsoft Intune
4 7 (0.37%) Grafana
4 7 (0.37%) logstash
4 7 (0.37%) Prometheus
5 6 (0.32%) Ansible
6 4 (0.21%) Nmap
7 3 (0.16%) CSIRT
7 3 (0.16%) Kibana
7 3 (0.16%) Kubeflow
7 3 (0.16%) Matomo
7 3 (0.16%) Nagios
7 3 (0.16%) Progress Chef
7 3 (0.16%) ZABBIX
8 2 (0.11%) Graphite
8 2 (0.11%) Puppet
8 2 (0.11%) SCCM
9 1 (0.053%) Oracle Identity Management
9 1 (0.053%) Single Sign-On
Vendors
1 242 (12.78%) Microsoft
2 238 (12.57%) Databricks
3 139 (7.34%) Google
4 105 (5.55%) Oracle
5 56 (2.96%) Bloomberg
6 49 (2.59%) SAP
7 35 (1.85%) Salesforce
8 29 (1.53%) CA
9 26 (1.37%) Alteryx
10 25 (1.32%) Adobe
11 19 (1.00%) ServiceNow
12 14 (0.74%) IBM
12 14 (0.74%) Sage
13 13 (0.69%) OpenAI
14 12 (0.63%) BISAM
14 12 (0.63%) BMC
14 12 (0.63%) F5
14 12 (0.63%) Remedy
15 11 (0.58%) Pega
15 11 (0.58%) Splunk