AngularJS Jobs in London

Angular
England > London

The table below provides summary statistics for permanent job vacancies advertised in London requiring AngularJS skills. It includes a benchmarking guide to the annual salaries offered in vacancies that cited AngularJS over the 6 months leading up to 19 March 2025, comparing them to the same period in the previous two years.

6 months to
19 Mar 2025
Same period 2024 Same period 2023
Rank 83 84 98
Rank change year-on-year +1 +14 -32
Permanent jobs citing AngularJS 511 733 1,374
As % of all permanent jobs advertised in London 3.72% 3.32% 3.49%
As % of the Libraries, Frameworks & Software Standards category 14.08% 12.88% 10.09%
Number of salaries quoted 332 640 1,123
10th Percentile £53,750 £52,375 £49,800
25th Percentile £63,688 £65,000 £58,875
Median annual salary (50th Percentile) £82,500 £82,500 £77,500
Median % change year-on-year - +6.45% +3.33%
75th Percentile £105,000 £100,000 £97,290
90th Percentile £115,000 £135,000 £115,000
England median annual salary £70,000 £60,000 £65,000
% change year-on-year +16.67% -7.69% +8.33%

All Software Libraries and Frameworks
London

AngularJS falls under the Software Libraries and Frameworks category. For comparison with the information above, the following table provides summary statistics for all permanent job vacancies requiring technical specification, industry standards, software libraries and framework skills in London.

Permanent vacancies with a requirement for technical specification, industry standards, software libraries and framework skills 3,629 5,690 13,617
As % of all permanent jobs advertised in London 26.43% 25.74% 34.59%
Number of salaries quoted 2,485 4,753 9,364
10th Percentile £51,250 £48,750 £50,000
25th Percentile £62,500 £60,000 £62,500
Median annual salary (50th Percentile) £82,500 £80,000 £80,000
Median % change year-on-year +3.13% - +6.67%
75th Percentile £110,000 £100,000 £100,000
90th Percentile £123,750 £122,500 £120,000
England median annual salary £66,230 £60,000 £67,500
% change year-on-year +10.38% -11.11% +8.00%

AngularJS
Job Vacancy Trend in London

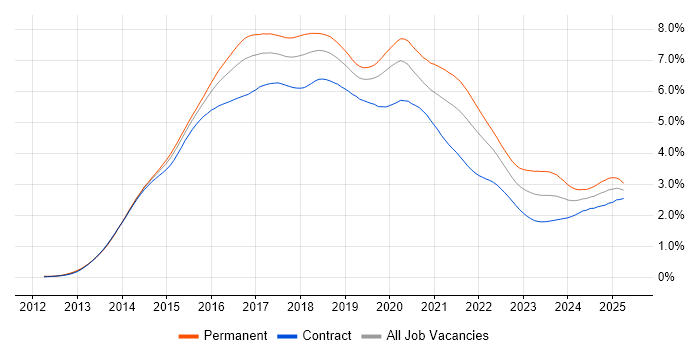
Job postings citing AngularJS as a proportion of all IT jobs advertised in London.

Job vacancy trend for AngularJS in London

AngularJS
Salary Trend in London

3-month moving average salary quoted in jobs citing AngularJS in London.

Salary trend for AngularJS in London

AngularJS
Salary Histogram in London

Salary distribution for jobs citing AngularJS in London over the 6 months to 19 March 2025.

Salary histogram for AngularJS in London

AngularJS
Job Locations in London

The table below looks at the demand and provides a guide to the median salaries quoted in IT jobs citing AngularJS within the London region over the 6 months to 19 March 2025. The 'Rank Change' column provides an indication of the change in demand within each location based on the same 6 month period last year.

Location Rank Change
on Same Period
Last Year
Matching
Permanent
IT Job Ads
Median Salary
Past 6 Months
Median Salary
% Change
on Same Period
Last Year
Live
Jobs
South London +20 90 £82,500 +10.00% 1
Central London +23 86 £78,750 -11.27% 13
West London +2 17 £62,000 +3.33% 4
North London +15 14 £60,000 -
East London +15 4 £47,500 - 1
AngularJS
England

AngularJS
Co-occurring Skills and Capabilities in London by Category

The follow tables expand on the table above by listing co-occurrences grouped by category. The same employment type, locality and period is covered with up to 20 co-occurrences shown in each of the following categories:

Application Platforms
1 42 (8.22%) Apache Airflow
2 36 (7.05%) Apache
3 20 (3.91%) nginx
4 4 (0.78%) CMS
5 3 (0.59%) WordPress
6 2 (0.39%) Confluence
6 2 (0.39%) IIS
6 2 (0.39%) OpenStack
6 2 (0.39%) Tornado
7 1 (0.20%) Apache Spark
7 1 (0.20%) JBoss
7 1 (0.20%) NServiceBus
7 1 (0.20%) Red Hat Fuse
7 1 (0.20%) SharePoint
Applications
1 4 (0.78%) Microsoft Office
2 3 (0.59%) MS Visio
3 2 (0.39%) Adobe Creative Suite
3 2 (0.39%) InDesign
3 2 (0.39%) Microsoft Excel
3 2 (0.39%) Photoshop
3 2 (0.39%) Trello
Business Applications
1 2 (0.39%) Eikon
1 2 (0.39%) RMDS
Cloud Services
1 274 (53.62%) AWS
2 110 (21.53%) Azure
3 101 (19.77%) Serverless
4 97 (18.98%) Amazon S3
4 97 (18.98%) GitHub
5 92 (18.00%) AWS Lambda
6 88 (17.22%) Amazon Kinesis
6 88 (17.22%) Amazon SQS
7 83 (16.24%) GCP
8 42 (8.22%) dbt
9 20 (3.91%) Azure DevOps
10 16 (3.13%) SaaS
11 8 (1.57%) MinIO
12 6 (1.17%) Azure Service Bus
12 6 (1.17%) Power Platform
13 5 (0.98%) Power Automate
14 4 (0.78%) Azure Functions
14 4 (0.78%) Azure Monitor
14 4 (0.78%) GitHub Actions
15 3 (0.59%) PowerApps
Communications & Networking
1 2 (0.39%) FTP
1 2 (0.39%) Value-Added Service
2 1 (0.20%) SMS
2 1 (0.20%) Wireshark
Database & Business Intelligence
1 122 (23.87%) PostgreSQL
2 112 (21.92%) DynamoDB
3 91 (17.81%) Redis
4 71 (13.89%) SQL Server
5 42 (8.22%) Amazon Athena
5 42 (8.22%) Apache Arrow
5 42 (8.22%) Apache Iceberg
5 42 (8.22%) Dremio
6 39 (7.63%) MongoDB
7 34 (6.65%) Apache Ignite
8 25 (4.89%) NoSQL
9 21 (4.11%) Amazon Aurora
10 20 (3.91%) Azure SQL Database
11 18 (3.52%) Relational Database
12 13 (2.54%) Elasticsearch
12 13 (2.54%) MySQL
13 6 (1.17%) Power BI
14 5 (0.98%) SQL Server Integration Services
14 5 (0.98%) SQL Server Reporting Services
15 4 (0.78%) NonStop SQL
Development Applications
1 94 (18.40%) Jenkins
2 60 (11.74%) Git
3 22 (4.31%) Jasmine
4 16 (3.13%) JIRA
5 13 (2.54%) Octopus Deploy
6 12 (2.35%) Karma Test Runner
7 10 (1.96%) TeamCity
8 9 (1.76%) Mocha
8 9 (1.76%) Selenium
8 9 (1.76%) webpack
9 8 (1.57%) Postman
10 7 (1.37%) JUnit
10 7 (1.37%) NUnit
11 6 (1.17%) Grunt
12 5 (0.98%) GitLab
12 5 (0.98%) Maven
13 4 (0.78%) SoapUI
13 4 (0.78%) SonarQube
13 4 (0.78%) Team Foundation Server
14 3 (0.59%) Mockito
General
1 180 (35.23%) Finance
2 114 (22.31%) Inclusion and Diversity
3 93 (18.20%) Marketing
4 91 (17.81%) Advertising
5 83 (16.24%) Front Office
6 73 (14.29%) Social Skills
7 52 (10.18%) Banking
8 36 (7.05%) Financial Institution
9 34 (6.65%) Analytical Skills
10 22 (4.31%) Law
11 15 (2.94%) Games
11 15 (2.94%) Public Sector
12 12 (2.35%) Legal
12 12 (2.35%) Retail Banking
13 10 (1.96%) Investment Banking
14 4 (0.78%) Publishing
15 3 (0.59%) Aviation
15 3 (0.59%) Manufacturing
15 3 (0.59%) Retail
16 2 (0.39%) Tech for Good
Job Titles
1 272 (53.23%) Developer
2 209 (40.90%) Software Engineer
3 111 (21.72%) Senior
4 69 (13.50%) Python Developer
5 61 (11.94%) Developer/Software Engineer
6 60 (11.74%) Senior Developer
7 56 (10.96%) Python Engineer
7 56 (10.96%) Python Software Engineer
8 53 (10.37%) AWS Developer
9 52 (10.18%) AWS Engineer
9 52 (10.18%) AWS Software Engineer
10 51 (9.98%) Full-Stack Developer
11 46 (9.00%) .NET Developer
12 37 (7.24%) Front-End Developer (Client-Side Developer)
13 35 (6.85%) C# Developer
14 34 (6.65%) Lead
15 30 (5.87%) Consultant
15 30 (5.87%) Full-Stack Engineer
16 28 (5.48%) ServiceNow Consultant
16 28 (5.48%) Technical Consultant
Libraries, Frameworks & Software Standards
1 335 (65.56%) React
2 223 (43.64%) Node.js
3 134 (26.22%) HTML
4 126 (24.66%) .NET
5 122 (23.87%) REST
6 113 (22.11%) CSS
7 110 (21.53%) Vue
8 89 (17.42%) Tailwind CSS
9 75 (14.68%) .NET Core
10 65 (12.72%) Pandas
11 61 (11.94%) NumPy
12 57 (11.15%) HTML5
13 55 (10.76%) RESTful
14 54 (10.57%) Spring
15 53 (10.37%) Spring Boot
16 52 (10.18%) SciPy
17 48 (9.39%) .NET Framework
17 48 (9.39%) Redux
18 37 (7.24%) ASP.NET
18 37 (7.24%) Entity Framework
Miscellaneous
1 88 (17.22%) Blog
1 88 (17.22%) Digital Media
2 59 (11.55%) Fixed Income
3 21 (4.11%) Hedge funds
4 14 (2.74%) Product Ownership
5 13 (2.54%) Cloud Native
5 13 (2.54%) Greenfield Project
6 12 (2.35%) Legacy Applications
7 11 (2.15%) Distributed Systems
8 10 (1.96%) Analytical Mindset
8 10 (1.96%) Team-Oriented Environment
9 8 (1.57%) Reinsurance
10 7 (1.37%) Mobile Games
10 7 (1.37%) Public Cloud
11 4 (0.78%) Algorithms
11 4 (0.78%) Client/Server
11 4 (0.78%) CMDB
11 4 (0.78%) Data Protection Act
11 4 (0.78%) Enterprise Software
11 4 (0.78%) Equities
Operating Systems
1 13 (2.54%) Windows
2 10 (1.96%) Linux
3 3 (0.59%) Android
3 3 (0.59%) Unix
4 2 (0.39%) CentOS
4 2 (0.39%) Mac OS
Processes & Methodologies
1 325 (63.60%) Agile
2 240 (46.97%) Software Engineering
3 195 (38.16%) Full-Stack Development
4 137 (26.81%) User Experience
5 136 (26.61%) Scrum
6 119 (23.29%) E-Commerce
7 99 (19.37%) Continuous Delivery
8 95 (18.59%) Microservices
9 91 (17.81%) Fintech
10 88 (17.22%) Epics
11 80 (15.66%) Asset Management
12 74 (14.48%) TDD
13 72 (14.09%) CI/CD
14 69 (13.50%) DevOps
15 68 (13.31%) Mentoring
16 62 (12.13%) Computer Science
17 61 (11.94%) Investment Management
18 59 (11.55%) Problem-Solving
19 52 (10.18%) Performance Attribution
20 50 (9.78%) Front End Development
Programming Languages
1 273 (53.42%) JavaScript
2 249 (48.73%) TypeScript
3 150 (29.35%) C#
4 133 (26.03%) Python
5 110 (21.53%) Java
6 104 (20.35%) SQL
7 13 (2.54%) Kotlin
8 12 (2.35%) Scala
9 9 (1.76%) PowerShell
9 9 (1.76%) Ruby
10 8 (1.57%) PHP
11 7 (1.37%) T-SQL
12 6 (1.17%) C
13 4 (0.78%) PL/SQL
14 3 (0.59%) Bash
14 3 (0.59%) Groovy
14 3 (0.59%) MATLAB
14 3 (0.59%) Shell Script
15 2 (0.39%) Clojure
15 2 (0.39%) Perl
Qualifications
1 64 (12.52%) Degree
2 30 (5.87%) Security Cleared
3 21 (4.11%) SC Cleared
4 17 (3.33%) Computer Science Degree
4 17 (3.33%) Master's Degree
5 8 (1.57%) PhD
6 3 (0.59%) Azure Certification
6 3 (0.59%) DV Cleared
7 2 (0.39%) CISSP
7 2 (0.39%) ISTQB
7 2 (0.39%) ISTQB Foundation Certification
7 2 (0.39%) Numerate Degree
8 1 (0.20%) BPSS Clearance
8 1 (0.20%) Microsoft Certification
8 1 (0.20%) SANS
Quality Assurance & Compliance
1 15 (2.94%) QA
2 12 (2.35%) Accessibility
3 4 (0.78%) GRC
4 2 (0.39%) MiFID
5 1 (0.20%) HIPAA
System Software
1 194 (37.96%) Docker
Systems Management
1 177 (34.64%) Kubernetes
2 15 (2.94%) Terraform
3 7 (1.37%) Istio
4 5 (0.98%) Single Sign-On
5 4 (0.78%) Ansible
6 3 (0.59%) Control-M
6 3 (0.59%) Grafana
6 3 (0.59%) Prometheus
6 3 (0.59%) Rundeck
7 2 (0.39%) HP Quality Center
7 2 (0.39%) MIIS
8 1 (0.20%) Bugsnag
8 1 (0.20%) RSA Archer
Vendors
1 34 (6.65%) ServiceNow
2 33 (6.46%) Microsoft
3 22 (4.31%) Oracle
4 14 (2.74%) Google
5 6 (1.17%) IBM
6 4 (0.78%) Bloomberg
6 4 (0.78%) Reuters
7 3 (0.59%) Facebook
7 3 (0.59%) Ping Identity
7 3 (0.59%) TikTok
7 3 (0.59%) YouTube
8 2 (0.39%) Adobe
8 2 (0.39%) Atlassian
8 2 (0.39%) Databricks
8 2 (0.39%) Dynatrace
8 2 (0.39%) Red Hat
9 1 (0.20%) CA Agile Central
9 1 (0.20%) Intel
9 1 (0.20%) Murex
9 1 (0.20%) Salesforce