Developer Job Trends in London

Developer
England > London

The median Developer salary in London is £80,000 per year, according to job vacancies posted during the 6 months leading to 28 November 2025.

The table below compares current salary benchmarking and summary statistics with the previous two years.

6 months to
28 Nov 2025
Same period 2024 Same period 2023
Rank 16 12 5
Rank change year-on-year -4 -7 +1
Permanent jobs requiring a Developer 1,350 2,462 3,223
As % of all permanent jobs in London 10.28% 14.02% 17.38%
As % of the Job Titles category 11.33% 14.82% 18.31%
Number of salaries quoted 967 1,687 2,933
10th Percentile £49,020 £49,084 £51,250
25th Percentile £60,000 £57,500 £62,500
Median annual salary (50th Percentile) £80,000 £76,000 £80,000
Median % change year-on-year +5.26% -5.00% +6.67%
75th Percentile £112,500 £100,625 £107,500
90th Percentile £137,500 £127,500 £142,500
England median annual salary £60,000 £60,000 £65,000
% change year-on-year - -7.69% +4.00%

All Permanent IT Job Vacancies
London

For comparison with the information above, the following table provides summary statistics for all permanent IT job vacancies in London. Most job vacancies include a discernible job title that can be normalized. As such, the figures in the second row provide an indication of the number of permanent jobs in our overall sample.

Permanent vacancies in London with a recognized job title 11,919 16,613 17,604
% of permanent jobs with a recognized job title 90.77% 94.59% 94.94%
Number of salaries quoted 7,727 10,094 14,365
10th Percentile £36,250 £41,250 £41,250
25th Percentile £50,000 £55,000 £55,000
Median annual salary (50th Percentile) £72,500 £75,000 £75,000
Median % change year-on-year -3.33% - +3.45%
75th Percentile £95,000 £95,000 £95,000
90th Percentile £117,500 £118,750 £115,000
England median annual salary £55,000 £57,560 £60,000
% change year-on-year -4.45% -4.07% -

Developer
Job Vacancy Trend in London

Historical trend showing the proportion of permanent IT job postings featuring 'Developer' in the job title relative to all permanent IT jobs advertised in London.
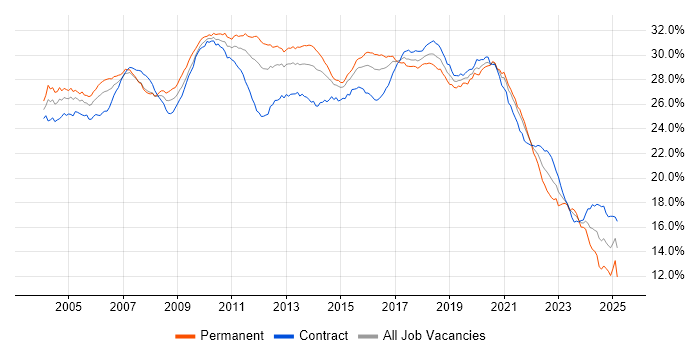
Developer job vacancy trend in London

Developer
Salary Trend in London

Salary distribution trend for Developer job vacancies in London.

Salary distribution trend for Developer job vacancies in London

Developer
Salary Histogram in London

Salary distribution for jobs citing Developer in London over the 6 months to 28 November 2025.

Salary histogram for Developer in London

Developer
Job Locations in London

The table below looks at the demand and provides a guide to the median salaries quoted in IT jobs citing Developer within the London region over the 6 months to 28 November 2025. The 'Rank Change' column provides an indication of the change in demand within each location based on the same 6 month period last year.

Location Rank Change
on Same Period
Last Year
Matching
Permanent
IT Job Ads
Median Salary
Past 6 Months
Median Salary
% Change
on Same Period
Last Year
Live
Jobs
Central London -4 233 £81,250 +12.07% 130
South London +26 39 £42,500 -22.73% 14
West London +8 19 £47,500 -28.03% 22
East London -16 3 - - 23
North London +2 2 £46,250 -22.92% 6
Developer
England

Developer Skill Set
Top 30 Co-Occurring Skills & Capabilities in London

For the 6 months to 28 November 2025, Developer job roles required the following skills and capabilities in order of popularity. The figures indicate the absolute number of co-occurrences and as a proportion of all permanent job ads across the London region featuring Developer in the job title.

1 523 (38.74%) Agile
2 479 (35.48%) Python
3 440 (32.59%) JavaScript
4 360 (26.67%) Azure
5 349 (25.85%) React
6 334 (24.74%) AWS
7 330 (24.44%) Java
8 310 (22.96%) SQL
9 291 (21.56%) CI/CD
10 284 (21.04%) C#
11 283 (20.96%) Full-Stack Development
12 275 (20.37%) TypeScript
13 268 (19.85%) Problem-Solving
14 248 (18.37%) Software Engineering
15 210 (15.56%) .NET
16 208 (15.41%) Microservices
17 204 (15.11%) Microsoft
18 197 (14.59%) Node.js
19 192 (14.22%) DevOps
20 178 (13.19%) HTML
21 177 (13.11%) REST
22 176 (13.04%) AngularJS
23 162 (12.00%) AI
24 161 (11.93%) Test Automation
25 150 (11.11%) CSS
25 150 (11.11%) Scrum
26 149 (11.04%) Degree
27 148 (10.96%) Power Platform
28 147 (10.89%) RESTful
29 144 (10.67%) Git

Developer Skill Set
Co-Occurring Skills & Capabilities in London by Category

The following tables expand on the one above by listing co-occurrences grouped by category. They cover the same employment type, locality and period, with up to 20 co-occurrences shown in each category:

Application Platforms
1 59 (4.37%) SharePoint
2 55 (4.07%) Apache Airflow
3 17 (1.26%) CMS
4 15 (1.11%) Confluence
5 13 (0.96%) Apache Spark
6 11 (0.81%) WordPress
7 10 (0.74%) Headless CMS
8 9 (0.67%) Apache
9 5 (0.37%) Microsoft Exchange
9 5 (0.37%) nginx
10 4 (0.30%) Jupyter
11 3 (0.22%) Apache Solr
12 2 (0.15%) Drupal
12 2 (0.15%) JBoss
12 2 (0.15%) OpenStack
12 2 (0.15%) Red Hat Fuse
12 2 (0.15%) Umbraco
13 1 (0.074%) Appian
13 1 (0.074%) Ethereum
13 1 (0.074%) Hyperledger
Applications
1 10 (0.74%) Microsoft Excel
2 9 (0.67%) MS Visio
3 6 (0.44%) Microsoft PowerPoint
4 5 (0.37%) Microsoft Office
5 4 (0.30%) Chatbot
6 3 (0.22%) Adobe XD
7 2 (0.15%) Sketch
8 1 (0.074%) Adobe Illustrator
Business Applications
1 16 (1.19%) Dynamics CRM
2 11 (0.81%) Shopify
3 7 (0.52%) NetSuite
4 6 (0.44%) ProductWriter
5 4 (0.30%) Dynamics NAV
5 4 (0.30%) Endur
6 3 (0.22%) Fidessa
6 3 (0.22%) Salesforce CRM
6 3 (0.22%) Temenos T24
7 2 (0.15%) NEC Housing
7 2 (0.15%) SAP S/4HANA
8 1 (0.074%) Adobe Campaign
8 1 (0.074%) ION Anvil
8 1 (0.074%) Magento
8 1 (0.074%) Misys Equation
8 1 (0.074%) Misys Midas
8 1 (0.074%) Payment Gateway
8 1 (0.074%) SAP ERP
8 1 (0.074%) SimCorp Dimension
Cloud Services
1 360 (26.67%) Azure
2 334 (24.74%) AWS
3 148 (10.96%) Power Platform
4 128 (9.48%) GCP
5 115 (8.52%) Serverless
6 88 (6.52%) GitHub
7 83 (6.15%) Power Automate
8 75 (5.56%) PowerApps
9 62 (4.59%) Dynamics 365
10 59 (4.37%) dbt
11 51 (3.78%) AWS Lambda
12 49 (3.63%) Azure DevOps
13 45 (3.33%) Azure Logic Apps
14 43 (3.19%) SaaS
15 41 (3.04%) Microsoft 365
16 39 (2.89%) Amazon EKS
17 35 (2.59%) Amazon ECS
18 31 (2.30%) Amazon S3
18 31 (2.30%) Amazon SQS
19 30 (2.22%) Azure Service Bus
Communications & Networking
1 25 (1.85%) TCP/IP
2 14 (1.04%) Broadband
3 12 (0.89%) Internet
3 12 (0.89%) Multicast
4 6 (0.44%) Wi-Fi
5 3 (0.22%) FTP
6 2 (0.15%) AMQP
6 2 (0.15%) DNS
7 1 (0.074%) ADSL
7 1 (0.074%) HTTP
7 1 (0.074%) Intranet
7 1 (0.074%) RFID
Database & Business Intelligence
1 139 (10.30%) PostgreSQL
2 112 (8.30%) SQL Server
3 110 (8.15%) Relational Database
4 96 (7.11%) Power BI
5 79 (5.85%) MongoDB
6 67 (4.96%) NoSQL
7 54 (4.00%) Amazon Athena
8 53 (3.93%) Apache Iceberg
8 53 (3.93%) Azure SQL Database
9 50 (3.70%) Apache Arrow
9 50 (3.70%) Dremio
10 45 (3.33%) Data Warehouse
11 44 (3.26%) Elasticsearch
12 39 (2.89%) RDBMS
13 36 (2.67%) MySQL
14 25 (1.85%) DynamoDB
15 21 (1.56%) Tick Data
16 17 (1.26%) Redis
17 15 (1.11%) Big Data
18 14 (1.04%) SQL Server Integration Services
Development Applications
1 144 (10.67%) Git
2 56 (4.15%) Jenkins
3 51 (3.78%) JIRA
4 25 (1.85%) Cypress.io
4 25 (1.85%) JUnit
5 23 (1.70%) JMeter
6 22 (1.63%) Mockito
7 19 (1.41%) Visual Studio
8 17 (1.26%) Selenium
9 15 (1.11%) webpack
10 11 (0.81%) GitLab
10 11 (0.81%) TeamCity
11 10 (0.74%) Cucumber
11 10 (0.74%) Visual Studio Code
12 8 (0.59%) Bitbucket
13 7 (0.52%) gulp
13 7 (0.52%) Team Foundation Server
14 6 (0.44%) Mocha
14 6 (0.44%) Vite
15 5 (0.37%) Postman
General
1 470 (34.81%) Finance
2 299 (22.15%) Social Skills
3 232 (17.19%) Front Office
4 163 (12.07%) Banking
5 82 (6.07%) Analytical Skills
6 77 (5.70%) Public Sector
7 75 (5.56%) Marketing
8 74 (5.48%) Inclusion and Diversity
8 74 (5.48%) Investment Banking
9 66 (4.89%) Law
10 32 (2.37%) Legal
11 27 (2.00%) Health Technology
12 26 (1.93%) Publishing
12 26 (1.93%) Retail
13 24 (1.78%) Tech for Good
14 19 (1.41%) Back Office
15 17 (1.26%) Billing
15 17 (1.26%) Manufacturing
16 15 (1.11%) Advertising
16 15 (1.11%) Financial Institution
Libraries, Frameworks & Software Standards
1 349 (25.85%) React
2 210 (15.56%) .NET
3 197 (14.59%) Node.js
4 178 (13.19%) HTML
5 177 (13.11%) REST
6 176 (13.04%) AngularJS
7 150 (11.11%) CSS
8 147 (10.89%) RESTful
9 135 (10.00%) Vue
10 95 (7.04%) Kafka
11 88 (6.52%) GraphQL
12 87 (6.44%) .NET Core
13 76 (5.63%) Spring
14 68 (5.04%) ASP.NET
15 65 (4.81%) Pandas
16 62 (4.59%) .NET Framework
17 58 (4.30%) JSON
17 58 (4.30%) NumPy
18 57 (4.22%) Web Services
19 53 (3.93%) Spring Boot
Miscellaneous
1 119 (8.81%) Fixed Income
2 111 (8.22%) Equities
3 102 (7.56%) Foreign Exchange (FX)
4 80 (5.93%) Cloud Native
5 73 (5.41%) Algorithms
6 72 (5.33%) Distributed Systems
7 58 (4.30%) Hedge funds
8 53 (3.93%) Data Structures
9 51 (3.78%) Greenfield Project
10 47 (3.48%) Onboarding
11 44 (3.26%) Management Information System
12 40 (2.96%) Derivative
12 40 (2.96%) Self-Motivation
13 38 (2.81%) Product Ownership
14 30 (2.22%) Legacy Systems
15 20 (1.48%) Mobile App
16 19 (1.41%) FPGA
16 19 (1.41%) Low-Code
17 15 (1.11%) Virtual Team
18 14 (1.04%) Market Risk
Operating Systems
1 103 (7.63%) Linux
2 17 (1.26%) Unix
3 13 (0.96%) Android
4 10 (0.74%) Apple iOS
4 10 (0.74%) Red Hat Enterprise Linux
5 8 (0.59%) Windows
6 7 (0.52%) Mac OS
7 3 (0.22%) Windows Server
8 1 (0.074%) MVS
Processes & Methodologies
1 523 (38.74%) Agile
2 291 (21.56%) CI/CD
3 283 (20.96%) Full-Stack Development
4 268 (19.85%) Problem-Solving
5 248 (18.37%) Software Engineering
6 208 (15.41%) Microservices
7 192 (14.22%) DevOps
8 162 (12.00%) AI
9 161 (11.93%) Test Automation
10 150 (11.11%) Scrum
11 144 (10.67%) User Experience
12 140 (10.37%) Computer Science
13 134 (9.93%) Low Latency
14 128 (9.48%) Analytics
14 128 (9.48%) Mentoring
14 128 (9.48%) TDD
15 125 (9.26%) Fintech
16 119 (8.81%) SDLC
17 118 (8.74%) Continuous Improvement
18 111 (8.22%) Code Quality
Programming Languages
1 479 (35.48%) Python
2 440 (32.59%) JavaScript
3 330 (24.44%) Java
4 310 (22.96%) SQL
5 284 (21.04%) C#
6 275 (20.37%) TypeScript
7 118 (8.74%) C++
8 45 (3.33%) Go
9 37 (2.74%) PHP
10 35 (2.59%) Apex Code
11 34 (2.52%) C
12 22 (1.63%) Shell Script
13 21 (1.56%) Kotlin
14 20 (1.48%) Data Analysis Expressions
15 17 (1.26%) PowerShell
16 14 (1.04%) T-SQL
17 13 (0.96%) Scala
18 12 (0.89%) Ruby
19 10 (0.74%) Bicep
20 9 (0.67%) Bash
Qualifications
1 149 (11.04%) Degree
2 83 (6.15%) Security Cleared
3 67 (4.96%) Computer Science Degree
4 47 (3.48%) SC Cleared
5 42 (3.11%) Master's Degree
6 33 (2.44%) Microsoft Certification
7 23 (1.70%) PhD
8 19 (1.41%) AWS Certification
9 18 (1.33%) DV Cleared
10 12 (0.89%) Azure Certification
11 9 (0.67%) AWS Certified Cloud Practitioner
12 5 (0.37%) AWS Certified Developer
13 4 (0.30%) DBS Check
13 4 (0.30%) Numerate Degree
14 3 (0.22%) AWS Certified Solutions Architect
15 2 (0.15%) HNC
15 2 (0.15%) HND
15 2 (0.15%) MCSA
15 2 (0.15%) MCSE
16 1 (0.074%) MCP
Quality Assurance & Compliance
1 94 (6.96%) QA
2 57 (4.22%) Accessibility
3 24 (1.78%) GDPR
4 15 (1.11%) Data Quality
5 9 (0.67%) WCAG
6 6 (0.44%) ISO/IEC 27001
7 5 (0.37%) PERC
8 4 (0.30%) ISO 9001
8 4 (0.30%) SLA
9 3 (0.22%) PCI DSS
10 2 (0.15%) MiFID
10 2 (0.15%) PSD2
11 1 (0.074%) EMIR
11 1 (0.074%) NCSC
11 1 (0.074%) NIST
11 1 (0.074%) PMO
System Software
1 135 (10.00%) Docker
2 6 (0.44%) Active Directory
3 4 (0.30%) zsh
4 2 (0.15%) Virtual Machines
5 1 (0.074%) Time Sharing Option
5 1 (0.074%) VMware Infrastructure
Systems Management
1 111 (8.22%) Kubernetes
2 32 (2.37%) Terraform
3 20 (1.48%) Kibana
4 6 (0.44%) Ansible
4 6 (0.44%) Jamf Pro
5 5 (0.37%) Grafana
5 5 (0.37%) Prometheus
6 3 (0.22%) Argo
6 3 (0.22%) Single Sign-On
7 2 (0.15%) Kubeflow
7 2 (0.15%) logstash
8 1 (0.074%) CA Endevor
8 1 (0.074%) Failover Clustering
8 1 (0.074%) QRadar
Vendors
1 204 (15.11%) Microsoft
2 58 (4.30%) Salesforce
3 39 (2.89%) Guidewire
4 35 (2.59%) Databricks
5 34 (2.52%) Oracle
6 26 (1.93%) Splunk
7 25 (1.85%) Dynatrace
7 25 (1.85%) Google
8 20 (1.48%) SAP
9 19 (1.41%) ServiceNow
10 18 (1.33%) Salesforce Marketing Cloud
11 15 (1.11%) Apple
12 13 (0.96%) Red Hat
13 12 (0.89%) Atlassian
13 12 (0.89%) OpenAI
14 9 (0.67%) Blue Prism
14 9 (0.67%) MuleSoft
15 8 (0.59%) Adobe
16 7 (0.52%) IBM
16 7 (0.52%) iManage