Google Jobs in London

Google
England > London

The table below provides summary statistics for permanent job vacancies advertised in London requiring knowledge or experience of Google products and/or services. It includes a benchmarking guide to the annual salaries offered in vacancies that cited Google over the 6 months leading up to 30 May 2025, comparing them to the same period in the previous two years.

The figures below represent the IT labour market in general and are not representative of salaries within Google.

6 months to
30 May 2025
Same period 2024 Same period 2023
Rank 63 93 74
Rank change year-on-year +30 -19 -22
Permanent jobs citing Google 600 776 1,348
As % of all permanent jobs advertised in London 4.73% 3.24% 4.11%
As % of the Vendors category 11.22% 8.21% 10.41%
Number of salaries quoted 238 592 823
10th Percentile £36,250 £36,250 £40,000
25th Percentile £52,500 £47,500 £53,750
Median annual salary (50th Percentile) £65,500 £70,000 £75,000
Median % change year-on-year -6.43% -6.67% +3.45%
75th Percentile £85,000 £99,063 £95,000
90th Percentile £98,625 £115,000 £114,750
England median annual salary £60,000 £55,000 £65,000
% change year-on-year +9.09% -15.38% +4.00%

All Vendors
London

Google falls under the Vendor Products and Services category. For comparison with the information above, the following table provides summary statistics for all permanent job vacancies requiring knowledge or experience of all vendor products and services in London.

Permanent vacancies with a requirement for knowledge or experience of vendor products and services 5,347 9,452 12,952
As % of all permanent jobs advertised in London 42.14% 39.43% 39.51%
Number of salaries quoted 3,128 6,494 8,985
10th Percentile £38,500 £35,500 £37,500
25th Percentile £51,250 £47,500 £50,000
Median annual salary (50th Percentile) £70,000 £67,500 £67,000
Median % change year-on-year +3.70% +0.75% +3.08%
75th Percentile £88,750 £87,500 £87,500
90th Percentile £110,000 £106,250 £104,677
England median annual salary £55,000 £50,000 £57,500
% change year-on-year +10.00% -13.04% +4.55%

Google
Job Vacancy Trend in London

Job postings citing Google as a proportion of all IT jobs advertised in London.
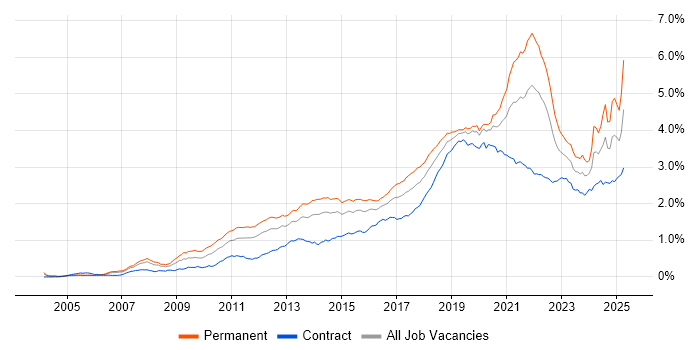
Job vacancy trend for Google in London

Google
Salary Trend in London

3-month moving average salary quoted in jobs citing Google in London.

Salary trend for Google in London

Google
Salary Histogram in London

Salary distribution for jobs citing Google in London over the 6 months to 30 May 2025.

Salary histogram for Google in London

Google
Job Locations in London

The table below looks at the demand and provides a guide to the median salaries quoted in IT jobs citing Google within the London region over the 6 months to 30 May 2025. The 'Rank Change' column provides an indication of the change in demand within each location based on the same 6 month period last year.

Location Rank Change
on Same Period
Last Year
Matching
Permanent
IT Job Ads
Median Salary
Past 6 Months
Median Salary
% Change
on Same Period
Last Year
Live
Jobs
Central London +23 107 £62,500 +8.70% 66
South London +22 33 £65,000 +36.84% 2
West London +19 22 £63,500 +38.04% 135
East London -11 16 - - 14
North London -10 7 - - 1
Google
England

Google
Co-occurring Skills and Capabilities in London by Category

The follow tables expand on the table above by listing co-occurrences grouped by category. The same employment type, locality and period is covered with up to 20 co-occurrences shown in each of the following categories:

Application Platforms
1 38 (6.33%) CMS
2 30 (5.00%) Apache Spark
3 23 (3.83%) WordPress
4 14 (2.33%) Microsoft Exchange
5 10 (1.67%) Drupal
6 8 (1.33%) Apache Airflow
7 7 (1.17%) SharePoint
8 6 (1.00%) Sitecore CMS
9 5 (0.83%) Confluence
10 4 (0.67%) nginx
11 3 (0.50%) Headless CMS
12 2 (0.33%) Adobe Experience Manager
12 2 (0.33%) Apache
13 1 (0.17%) Apache Solr
13 1 (0.17%) Ethereum
13 1 (0.17%) OpenStack
13 1 (0.17%) Oracle Workflow
Applications
1 32 (5.33%) Microsoft Excel
2 17 (2.83%) Photoshop
3 16 (2.67%) Microsoft Office
3 16 (2.67%) Microsoft PowerPoint
4 11 (1.83%) Adobe Premiere
5 8 (1.33%) Adobe After Effects
5 8 (1.33%) CapCut
6 5 (0.83%) Chatbot
7 4 (0.67%) MS Visio
7 4 (0.67%) Notion
8 3 (0.50%) Adobe Creative Suite
8 3 (0.50%) Adobe XD
8 3 (0.50%) Maya
8 3 (0.50%) Microsoft Project
9 2 (0.33%) Adobe Illustrator
9 2 (0.33%) InDesign
10 1 (0.17%) Sketch
Business Applications
1 7 (1.17%) Shopify
2 3 (0.50%) CiviCRM
2 3 (0.50%) Dynamics CRM
2 3 (0.50%) Payment Gateway
2 3 (0.50%) Salesforce CRM
2 3 (0.50%) SAP S/4HANA
3 1 (0.17%) Cloudability
3 1 (0.17%) Lorenzo
3 1 (0.17%) Magento
3 1 (0.17%) SystmOne
Cloud Services
1 234 (39.00%) AWS
2 197 (32.83%) GCP
3 184 (30.67%) Azure
4 128 (21.33%) Google Analytics
5 71 (11.83%) Pulumi
6 59 (9.83%) SaaS
7 44 (7.33%) Power Platform
8 42 (7.00%) Google Ads
9 41 (6.83%) Google Workspace
10 32 (5.33%) Microsoft 365
11 30 (5.00%) Google Sheets
12 24 (4.00%) GitHub
13 21 (3.50%) Canva
14 19 (3.17%) Azure DevOps
15 18 (3.00%) Slack
16 17 (2.83%) Azure Monitor
17 16 (2.67%) Cloud Computing
17 16 (2.67%) Facebook Ads
17 16 (2.67%) Microsoft Copilot
17 16 (2.67%) Serverless
Communications & Networking
1 67 (11.17%) Broadband
2 22 (3.67%) HTTP
3 17 (2.83%) Firewall
4 14 (2.33%) DNS
5 12 (2.00%) TCP/IP
5 12 (2.00%) VPN
6 11 (1.83%) Network Security
7 10 (1.67%) LAN
7 10 (1.67%) VLAN
7 10 (1.67%) WAN
7 10 (1.67%) Wireless
8 9 (1.50%) Wi-Fi
9 8 (1.33%) Internet
10 6 (1.00%) SMS
10 6 (1.00%) SMTP
10 6 (1.00%) SSL
11 5 (0.83%) MQTT
12 4 (0.67%) SD-WAN
12 4 (0.67%) Wireshark
13 3 (0.50%) Cisco ISE
Database & Business Intelligence
1 112 (18.67%) NoSQL
2 89 (14.83%) Relational Database
3 77 (12.83%) RDBMS
4 40 (6.67%) Power BI
5 35 (5.83%) PostgreSQL
6 26 (4.33%) Data Warehouse
7 24 (4.00%) Tableau
8 23 (3.83%) BigQuery
8 23 (3.83%) MongoDB
9 22 (3.67%) MySQL
10 21 (3.50%) Looker
11 17 (2.83%) Metadata
12 16 (2.67%) Data Lake
13 14 (2.33%) Big Data
14 13 (2.17%) Hadoop
15 9 (1.50%) Amazon RDS
15 9 (1.50%) Amazon Redshift
15 9 (1.50%) Data Mining
16 8 (1.33%) Elasticsearch
17 6 (1.00%) Redis
Development Applications
1 67 (11.17%) Jaeger
2 20 (3.33%) Git
3 18 (3.00%) JIRA
4 11 (1.83%) Jenkins
5 6 (1.00%) Gradle
5 6 (1.00%) Maven
6 5 (0.83%) CircleCI
6 5 (0.83%) GitLab
7 4 (0.67%) Bazaar
7 4 (0.67%) Postman
8 3 (0.50%) Storybook
9 2 (0.33%) Atlassian Bamboo
9 2 (0.33%) Axure RP
9 2 (0.33%) Balsamiq
9 2 (0.33%) Spinnaker
9 2 (0.33%) SQL Server Management Studio (SSMS)
9 2 (0.33%) YouTrack
10 1 (0.17%) Cypress.io
10 1 (0.17%) Selenium
10 1 (0.17%) WebDriver
General
1 216 (36.00%) Social Skills
2 157 (26.17%) Marketing
3 133 (22.17%) Inclusion and Diversity
4 113 (18.83%) Finance
5 112 (18.67%) Analytical Skills
6 80 (13.33%) Advertising
7 76 (12.67%) Retail
8 65 (10.83%) Law
9 34 (5.67%) Games
10 33 (5.50%) Manufacturing
11 31 (5.17%) Public Sector
12 23 (3.83%) Organisational Skills
13 20 (3.33%) Telecoms
14 18 (3.00%) Legal
14 18 (3.00%) Presentation Skills
15 12 (2.00%) Brand Awareness
15 12 (2.00%) Publishing
16 11 (1.83%) Electronics
17 10 (1.67%) Banking
18 6 (1.00%) Pharmaceutical
Job Titles
1 126 (21.00%) Lead
2 109 (18.17%) Senior
3 67 (11.17%) Team Leader
4 60 (10.00%) Architect
5 49 (8.17%) Developer
6 38 (6.33%) Analyst
7 37 (6.17%) Solutions Architect
8 32 (5.33%) Software Engineer
9 25 (4.17%) Senior Developer
10 21 (3.50%) Data Engineer
10 21 (3.50%) Senior Software Engineer
11 20 (3.33%) Platform Engineer
12 19 (3.17%) Senior Architect
12 19 (3.17%) SEO Specialist
13 18 (3.00%) GCP Engineer
13 18 (3.00%) Python Engineer
13 18 (3.00%) Trainer
14 17 (2.83%) Cloud Engineer
14 17 (2.83%) Full-Stack Developer
15 16 (2.67%) Senior Solutions Architect
Libraries, Frameworks & Software Standards
1 74 (12.33%) Elastic Stack
2 67 (11.17%) OpenTelemetry
3 44 (7.33%) Kafka
4 38 (6.33%) REST
5 33 (5.50%) HTML
6 29 (4.83%) Flask
7 26 (4.33%) CSS
7 26 (4.33%) React
8 24 (4.00%) FastAPI
9 20 (3.33%) RESTful
10 16 (2.67%) Node.js
10 16 (2.67%) RabbitMQ
11 14 (2.33%) ARM Templates
12 12 (2.00%) GraphQL
12 12 (2.00%) Spring
13 10 (1.67%) Django
14 9 (1.50%) AngularJS
15 8 (1.33%) HTML5
15 8 (1.33%) React Native
16 7 (1.17%) Vue
Miscellaneous
1 68 (11.33%) Social Media
2 49 (8.17%) Cloud Native
3 28 (4.67%) Blog
4 27 (4.50%) Self-Motivation
5 26 (4.33%) Distributed Systems
5 26 (4.33%) Management Information System
6 25 (4.17%) Algorithms
7 20 (3.33%) Product Ownership
8 18 (3.00%) Public Cloud
9 17 (2.83%) Data Structures
10 16 (2.67%) Analytical Mindset
11 15 (2.50%) Robotics
12 13 (2.17%) Enterprise Software
12 13 (2.17%) Legacy Systems
12 13 (2.17%) Mobile Games
13 12 (2.00%) Onboarding
14 11 (1.83%) Digital Media
14 11 (1.83%) Hybrid Cloud
14 11 (1.83%) Mobile App
14 11 (1.83%) Video Editing
Operating Systems
1 85 (14.17%) Linux
2 77 (12.83%) Unix
3 19 (3.17%) Windows
4 10 (1.67%) Windows Server
5 6 (1.00%) Mac OS
6 5 (0.83%) Windows 10
7 4 (0.67%) Android
7 4 (0.67%) VMS
8 2 (0.33%) Apple iOS
8 2 (0.33%) Windows 7
9 1 (0.17%) Mac OS X
9 1 (0.17%) Windows Server 2008
9 1 (0.17%) Windows Server 2012
9 1 (0.17%) Windows Server 2016
9 1 (0.17%) Windows Server 2019
Processes & Methodologies
1 217 (36.17%) Analytics
2 183 (30.50%) Agile
3 154 (25.67%) Problem-Solving
4 151 (25.17%) Roadmaps
5 149 (24.83%) DevOps
6 129 (21.50%) Containerisation
7 114 (19.00%) Infrastructure as Code
8 110 (18.33%) Mentoring
9 105 (17.50%) CI/CD
10 90 (15.00%) SEO
11 89 (14.83%) High Availability
12 87 (14.50%) Cost Optimisation
13 86 (14.33%) Product Management
14 84 (14.00%) Continuous Integration
15 83 (13.83%) Resource Management
15 83 (13.83%) Task Automation
16 80 (13.33%) Artificial Intelligence
17 75 (12.50%) Performance Optimisation
18 68 (11.33%) Project Management
19 67 (11.17%) Software Engineering
Programming Languages
1 211 (35.17%) Python
2 118 (19.67%) Java
3 106 (17.67%) JavaScript
4 102 (17.00%) SQL
5 79 (13.17%) Bash
6 76 (12.67%) Go
7 33 (5.50%) Scala
8 24 (4.00%) C#
9 23 (3.83%) TypeScript
10 14 (2.33%) PowerShell
11 11 (1.83%) PHP
12 10 (1.67%) R
13 7 (1.17%) Kotlin
13 7 (1.17%) Shell Script
14 6 (1.00%) C++
14 6 (1.00%) T-SQL
15 5 (0.83%) Data Analysis Expressions
16 4 (0.67%) Rust
17 2 (0.33%) C
18 1 (0.17%) Swift
Qualifications
1 128 (21.33%) Degree
2 96 (16.00%) AWS Certification
3 43 (7.17%) Computer Science Degree
4 30 (5.00%) Azure Certification
5 22 (3.67%) Security Cleared
6 20 (3.33%) AWS Certified Solutions Architect
7 19 (3.17%) Master's Degree
8 18 (3.00%) SC Cleared
9 12 (2.00%) Cisco Certification
10 10 (1.67%) (ISC)2 CCSP
11 9 (1.50%) CCSP
12 8 (1.33%) CISSP
13 7 (1.17%) CISA
14 6 (1.00%) CISM
14 6 (1.00%) DBS Check
14 6 (1.00%) PMI Certification
15 5 (0.83%) TOGAF Certification
16 4 (0.67%) CCSK
16 4 (0.67%) Microsoft Certification
17 3 (0.50%) PMP
Quality Assurance & Compliance
1 43 (7.17%) GDPR
2 29 (4.83%) QA
3 18 (3.00%) Accessibility
4 17 (2.83%) NIST
5 16 (2.67%) Data Quality
6 11 (1.83%) California Consumer Privacy Act
6 11 (1.83%) ISO/IEC 27001
7 7 (1.17%) SLA
8 6 (1.00%) Cyber Essentials
8 6 (1.00%) HIPAA
8 6 (1.00%) Sarbanes-Oxley
8 6 (1.00%) SOC 2
9 5 (0.83%) Actionable Recommendations
9 5 (0.83%) PCI DSS
10 4 (0.67%) WCAG
11 3 (0.50%) PMO
12 2 (0.33%) COBIT
13 1 (0.17%) GRC
13 1 (0.17%) HL7
13 1 (0.17%) SNOMED CT
System Software
1 151 (25.17%) Docker
2 20 (3.33%) Active Directory
3 7 (1.17%) VMware Infrastructure
4 6 (1.00%) Hyper-V
5 3 (0.50%) VMware NSX
6 2 (0.33%) Virtual Machines
6 2 (0.33%) VMware Workstation
6 2 (0.33%) vSphere
6 2 (0.33%) XenApp
6 2 (0.33%) XenDesktop
7 1 (0.17%) HDFS
7 1 (0.17%) Virtual Servers
Systems Management
1 156 (26.00%) Terraform
2 151 (25.17%) Kubernetes
3 81 (13.50%) Ansible
4 78 (13.00%) Prometheus
5 74 (12.33%) Argo
6 69 (11.50%) Kustomize
7 11 (1.83%) Microsoft Intune
8 10 (1.67%) Jamf Pro
9 9 (1.50%) Single Sign-On
10 7 (1.17%) Grafana
11 6 (1.00%) Puppet
12 5 (0.83%) Istio
13 4 (0.67%) linkerd
13 4 (0.67%) Matomo
13 4 (0.67%) Progress Chef
14 3 (0.50%) AWS Copilot
14 3 (0.50%) FortiGate
14 3 (0.50%) Salt
15 2 (0.33%) Active Directory Federation Services
15 2 (0.33%) CASB
Vendors
1 161 (26.83%) Microsoft
2 60 (10.00%) Adobe
3 36 (6.00%) TikTok
4 30 (5.00%) Salesforce
5 28 (4.67%) Databricks
6 26 (4.33%) Apple
6 26 (4.33%) SAP
7 25 (4.17%) Ahrefs
7 25 (4.17%) Facebook
7 25 (4.17%) ServiceNow
8 18 (3.00%) Instagram
9 17 (2.83%) Screaming Frog
10 16 (2.67%) Cisco
10 16 (2.67%) VMware
11 14 (2.33%) Oracle
12 13 (2.17%) OpenAI
12 13 (2.17%) Pinterest
13 12 (2.00%) Workday
14 10 (1.67%) HubSpot
14 10 (1.67%) Meraki