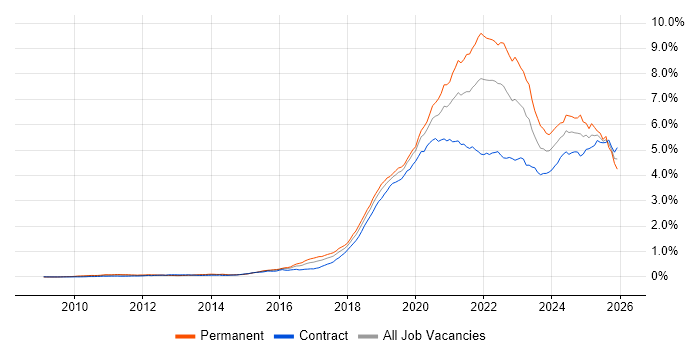
GCP Jobs in London

Google Cloud Platform (GCP)
England > London

The table below provides summary statistics for permanent job vacancies advertised in London requiring GCP skills. It includes a benchmarking guide to the annual salaries offered in vacancies that cited GCP over the 6 months leading up to 27 July 2024, comparing them to the same period in the previous two years.

6 months to
27 Jul 2024
Same period 2023 Same period 2022
Rank 30 28 29
Rank change year-on-year -2 +1 +3
Permanent jobs citing GCP 1,306 2,140 7,658
As % of all permanent jobs advertised in London 6.31% 7.93% 10.23%
As % of the Cloud Services category 14.83% 16.11% 18.78%
Number of salaries quoted 933 1,699 2,726
10th Percentile £65,000 £58,400 £56,250
25th Percentile £78,750 £70,735 £65,000
Median annual salary (50th Percentile) £105,000 £90,000 £87,500
Median % change year-on-year +16.67% +2.86% +6.06%
75th Percentile £142,500 £116,743 £110,000
90th Percentile £165,000 £143,750 £132,500
England median annual salary £85,000 £80,000 £80,000
% change year-on-year +6.25% - +6.67%

All Cloud Skills
London

GCP falls under the Cloud Services category. For comparison with the information above, the following table provides summary statistics for all permanent job vacancies requiring cloud computing skills in London.

Permanent vacancies with a requirement for cloud computing skills 8,807 13,287 40,786
As % of all permanent jobs advertised in London 42.54% 49.22% 54.46%
Number of salaries quoted 6,718 10,945 18,229
10th Percentile £42,275 £41,250 £42,500
25th Percentile £56,250 £55,000 £55,000
Median annual salary (50th Percentile) £77,500 £75,000 £72,500
Median % change year-on-year +3.33% +3.45% -
75th Percentile £97,500 £95,000 £93,750
90th Percentile £122,500 £115,000 £112,500
England median annual salary £60,000 £65,000 £62,500
% change year-on-year -7.69% +4.00% +4.17%

GCP
Job Vacancy Trend in London

Job postings citing GCP as a proportion of all IT jobs advertised in London.

Job vacancy trend for GCP in London

GCP
Salary Trend in London

3-month moving average salary quoted in jobs citing GCP in London.

Salary trend for GCP in London

GCP
Salary Histogram in London

Salary distribution for jobs citing GCP in London over the 6 months to 27 July 2024.

Salary histogram for GCP in London

GCP
Job Locations in London

The table below looks at the demand and provides a guide to the median salaries quoted in IT jobs citing GCP within the London region over the 6 months to 27 July 2024. The 'Rank Change' column provides an indication of the change in demand within each location based on the same 6 month period last year.

Location Rank Change
on Same Period
Last Year
Matching
Permanent
IT Job Ads
Median Salary
Past 6 Months
Median Salary
% Change
on Same Period
Last Year
Live
Jobs
Central London -51 96 £70,500 -17.06% 21
West London -8 9 £50,000 -47.37% 6
South London -39 3 - -
East London +15 1 - - 4
GCP
England

GCP
Co-occurring Skills and Capabilities in London by Category

The follow tables expand on the table above by listing co-occurrences grouped by category. The same employment type, locality and period is covered with up to 20 co-occurrences shown in each of the following categories:

Application Platforms
1 484 (37.06%) Apache Airflow
2 431 (33.00%) Apache
3 67 (5.13%) Apache Spark
4 20 (1.53%) Microsoft Exchange
5 15 (1.15%) nginx
6 9 (0.69%) SharePoint
6 9 (0.69%) SharePoint 2010
6 9 (0.69%) SharePoint 2013
7 7 (0.54%) Confluence
8 4 (0.31%) Apache Pulsar
8 4 (0.31%) OpenStack
9 2 (0.15%) Oracle SOA Suite
9 2 (0.15%) Tomcat
10 1 (0.077%) Apache Solr
10 1 (0.077%) CMS
10 1 (0.077%) IIS
10 1 (0.077%) Luigi
10 1 (0.077%) Oracle Service Bus
10 1 (0.077%) SAS
10 1 (0.077%) WebLogic
Applications
1 14 (1.07%) Microsoft Excel
2 10 (0.77%) Microsoft Office
3 4 (0.31%) Trello
4 2 (0.15%) Microsoft PowerPoint
Business Applications
1 45 (3.45%) Ripple
2 1 (0.077%) HFM
2 1 (0.077%) Magento
2 1 (0.077%) Oracle FAH
2 1 (0.077%) Remedy ITSM
2 1 (0.077%) SAP S/4HANA
Cloud Services
1 1,121 (85.83%) AWS
2 704 (53.91%) Azure
3 313 (23.97%) dbt
4 262 (20.06%) Snowflake
5 98 (7.50%) Amazon EKS
6 78 (5.97%) Amazon EC2
7 75 (5.74%) Amazon ECS
8 57 (4.36%) GitHub
9 56 (4.29%) SaaS
10 50 (3.83%) Cloud Computing
11 44 (3.37%) PaaS
12 36 (2.76%) Microsoft 365
13 32 (2.45%) Dagster
14 29 (2.22%) Power Platform
15 27 (2.07%) Azure DevOps
15 27 (2.07%) IaaS
16 26 (1.99%) AWS CloudFormation
17 25 (1.91%) Serverless
18 24 (1.84%) Amazon Kinesis
19 23 (1.76%) Azure AKS
Communications & Networking
1 35 (2.68%) Firewall
2 28 (2.14%) DNS
3 22 (1.68%) LAN
3 22 (1.68%) Network Security
3 22 (1.68%) WAN
4 14 (1.07%) VPN
5 11 (0.84%) HTTP
6 10 (0.77%) TCP/IP
7 7 (0.54%) Broadband
7 7 (0.54%) MQTT
7 7 (0.54%) Wi-Fi
8 6 (0.46%) Modbus
8 6 (0.46%) SD-WAN
8 6 (0.46%) SSH
9 5 (0.38%) 5G
9 5 (0.38%) AMQP
9 5 (0.38%) Internet
9 5 (0.38%) VLAN
10 4 (0.31%) BGP
10 4 (0.31%) Wireless
Database & Business Intelligence
1 391 (29.94%) Apache Ignite
2 301 (23.05%) Amazon Athena
3 293 (22.43%) Dremio
4 284 (21.75%) Data Lake
5 263 (20.14%) Apache Arrow
6 122 (9.34%) PostgreSQL
7 108 (8.27%) BigQuery
8 56 (4.29%) Data Warehouse
9 49 (3.75%) NoSQL
10 48 (3.68%) Big Data
11 35 (2.68%) Looker
12 31 (2.37%) Hadoop
13 30 (2.30%) SQL Server
14 27 (2.07%) MongoDB
15 26 (1.99%) Power BI
16 25 (1.91%) Metadata
17 24 (1.84%) Data Mining
18 23 (1.76%) Relational Database
19 22 (1.68%) Amazon Redshift
20 21 (1.61%) Elasticsearch
Development Applications
1 78 (5.97%) Git
2 72 (5.51%) Cypress.io
3 66 (5.05%) Jenkins
4 41 (3.14%) GitLab
5 22 (1.68%) TeamCity
6 16 (1.23%) Artifactory
7 15 (1.15%) JIRA
8 13 (1.00%) SonarQube
9 10 (0.77%) Maven
9 10 (0.77%) Spinnaker
10 9 (0.69%) CircleCI
10 9 (0.69%) Sonatype Nexus
11 8 (0.61%) Gradle
12 7 (0.54%) MLflow
13 6 (0.46%) Cucumber
13 6 (0.46%) MSI
14 5 (0.38%) Mocha
14 5 (0.38%) Terragrunt
15 4 (0.31%) Burp Suite
15 4 (0.31%) Visual Studio
General
1 744 (56.97%) Finance
2 539 (41.27%) Banking
3 512 (39.20%) Front Office
4 237 (18.15%) Investment Banking
5 199 (15.24%) Social Skills
6 156 (11.94%) Inclusion and Diversity
7 125 (9.57%) Law
8 97 (7.43%) Analytical Skills
9 79 (6.05%) Financial Institution
10 67 (5.13%) Retail
11 62 (4.75%) Legal
12 46 (3.52%) Retail Banking
13 40 (3.06%) Back Office
14 32 (2.45%) Presentation Skills
15 29 (2.22%) Public Sector
16 25 (1.91%) Marketing
17 16 (1.23%) Telecoms
18 15 (1.15%) Documentation Skills
19 13 (1.00%) Electronics
20 11 (0.84%) Games
Job Titles
1 484 (37.06%) Software Engineer
2 411 (31.47%) Developer
3 337 (25.80%) Developer/Software Engineer
4 271 (20.75%) Architect
5 252 (19.30%) Python Engineer
6 242 (18.53%) Senior
7 213 (16.31%) Lead
8 205 (15.70%) Python Developer
9 203 (15.54%) Python Software Engineer
10 154 (11.79%) Solutions Architect
11 140 (10.72%) Lead Software Engineer
11 140 (10.72%) React Developer
12 121 (9.26%) Software Developer
13 109 (8.35%) Lead Developer
13 109 (8.35%) Team Leader
14 107 (8.19%) Lead Software Developer
15 106 (8.12%) Software Team Leader
16 105 (8.04%) Data Engineer
17 99 (7.58%) Java Engineer
18 93 (7.12%) Java Software Engineer
Libraries, Frameworks & Software Standards
1 410 (31.39%) gRPC
2 404 (30.93%) Protocol Buffers
3 320 (24.50%) React
4 303 (23.20%) Pandas
5 294 (22.51%) NumPy
6 289 (22.13%) SciPy
7 228 (17.46%) Redux
8 126 (9.65%) PySpark
9 115 (8.81%) Material-UI
10 98 (7.50%) AngularJS
11 97 (7.43%) Node.js
12 93 (7.12%) .NET
13 83 (6.36%) Vue
14 77 (5.90%) Kafka
15 54 (4.13%) REST
15 54 (4.13%) Spring
16 51 (3.91%) .NET Core
17 34 (2.60%) GraphQL
18 28 (2.14%) Apache Beam
18 28 (2.14%) Web Services
Miscellaneous
1 483 (36.98%) Fixed Income
2 400 (30.63%) Hedge funds
3 368 (28.18%) Equities
4 306 (23.43%) Derivative
5 296 (22.66%) Foreign Exchange (FX)
6 80 (6.13%) Cloud Native
7 71 (5.44%) Public Cloud
8 52 (3.98%) Blockchain
9 44 (3.37%) Self-Motivation
10 38 (2.91%) Blog
11 36 (2.76%) Management Information System
12 33 (2.53%) Product Ownership
13 31 (2.37%) NFT
14 30 (2.30%) Distributed Systems
15 29 (2.22%) Algorithms
15 29 (2.22%) Greenfield Project
16 27 (2.07%) Data Structures
17 21 (1.61%) Data Centre
18 19 (1.45%) Hybrid Cloud
18 19 (1.45%) PKI
Operating Systems
1 60 (4.59%) Windows
2 58 (4.44%) Linux
3 19 (1.45%) Windows Server
4 16 (1.23%) zOS
5 11 (0.84%) CentOS
5 11 (0.84%) Unix
6 6 (0.46%) Android
6 6 (0.46%) Apple iOS
6 6 (0.46%) Ubuntu
7 5 (0.38%) Solaris
8 4 (0.31%) Kali Linux
8 4 (0.31%) Mac OS
8 4 (0.31%) Red Hat Enterprise Linux
8 4 (0.31%) VMS
9 1 (0.077%) CoreOS
9 1 (0.077%) Rocky
Processes & Methodologies
1 783 (59.95%) Agile
2 732 (56.05%) Software Engineering
3 586 (44.87%) Asset Management
4 339 (25.96%) Investment Management
5 258 (19.75%) Fintech
6 225 (17.23%) CI/CD
7 223 (17.08%) DevOps
8 222 (17.00%) Full Stack Development
9 213 (16.31%) Line Management
9 213 (16.31%) Machine Learning
10 203 (15.54%) Analytics
11 189 (14.47%) Artificial Intelligence
12 187 (14.32%) Migration
12 187 (14.32%) Problem-Solving
13 144 (11.03%) Infrastructure as Code
13 144 (11.03%) Mentoring
14 133 (10.18%) Computer Science
15 130 (9.95%) Microservices
16 114 (8.73%) Data Engineering
17 100 (7.66%) Automated Trading
Programming Languages
1 768 (58.81%) Python
2 493 (37.75%) TypeScript
3 490 (37.52%) Java
4 453 (34.69%) JavaScript
5 312 (23.89%) SQL
6 90 (6.89%) C#
7 84 (6.43%) Scala
8 76 (5.82%) Kotlin
9 54 (4.13%) Go
10 37 (2.83%) Rust
11 30 (2.30%) Solidity
12 29 (2.22%) Bash
13 22 (1.68%) R
14 21 (1.61%) PowerShell
15 20 (1.53%) Ruby
16 14 (1.07%) C++
16 14 (1.07%) Shell Script
17 8 (0.61%) Bicep
18 6 (0.46%) C
18 6 (0.46%) PHP
Qualifications
1 141 (10.80%) Degree
2 73 (5.59%) Computer Science Degree
3 59 (4.52%) AWS Certification
4 35 (2.68%) CISSP
5 32 (2.45%) Security Cleared
6 29 (2.22%) Azure Certification
6 29 (2.22%) Master's Degree
7 24 (1.84%) Cisco Certification
7 24 (1.84%) CRISC
8 19 (1.45%) CCNP
9 18 (1.38%) CCNA
9 18 (1.38%) SC Cleared
10 16 (1.23%) CEH
10 16 (1.23%) CISA
11 15 (1.15%) Microsoft Certification
12 14 (1.07%) AWS Certified Solutions Architect
12 14 (1.07%) CISM
13 11 (0.84%) DV Cleared
13 11 (0.84%) GIAC
13 11 (0.84%) PhD
Quality Assurance & Compliance
1 81 (6.20%) QA
2 38 (2.91%) Data Quality
3 27 (2.07%) ISO/IEC 27001
4 21 (1.61%) GDPR
5 20 (1.53%) NIST
6 17 (1.30%) PCI DSS
7 12 (0.92%) SLA
8 9 (0.69%) COBIT
9 8 (0.61%) Accessibility
10 7 (0.54%) ISO 9001
11 6 (0.46%) SOC 2
12 5 (0.38%) Cyber Essentials
13 4 (0.31%) ISO/IEC 27002 (supersedes ISO/IEC 17799)
13 4 (0.31%) NCSC
14 3 (0.23%) HIPAA
15 1 (0.077%) ITGC
15 1 (0.077%) Sarbanes-Oxley
System Software
1 172 (13.17%) Docker
2 32 (2.45%) VMware Infrastructure
3 25 (1.91%) Active Directory
4 23 (1.76%) Virtual Machines
5 15 (1.15%) Hyper-V
6 12 (0.92%) XenApp
6 12 (0.92%) XenDesktop
7 4 (0.31%) HDFS
8 3 (0.23%) VMware Workstation
9 2 (0.15%) Varnish
9 2 (0.15%) vSphere
10 1 (0.077%) Virtual Desktop
10 1 (0.077%) VMware ESXi
10 1 (0.077%) VMware NSX
Systems Management
1 196 (15.01%) Kubernetes
2 186 (14.24%) Terraform
3 56 (4.29%) Ansible
4 30 (2.30%) Grafana
5 17 (1.30%) Prometheus
6 13 (1.00%) Istio
6 13 (1.00%) SCCM
7 12 (0.92%) Microsoft Intune
8 11 (0.84%) Progress Chef
8 11 (0.84%) Puppet
9 6 (0.46%) Argo
9 6 (0.46%) Packer
10 5 (0.38%) Active Directory Federation Services
10 5 (0.38%) logstash
10 5 (0.38%) Nagios
11 4 (0.31%) Nessus
11 4 (0.31%) Nmap
12 3 (0.23%) Graphite
12 3 (0.23%) Kubeflow
12 3 (0.23%) Salt
Vendors
1 396 (30.32%) Google
2 135 (10.34%) Microsoft
3 70 (5.36%) Databricks
4 69 (5.28%) Bloomberg
5 60 (4.59%) Reuters
6 35 (2.68%) VMware
7 23 (1.76%) Cisco
7 23 (1.76%) ServiceNow
8 20 (1.53%) Oracle
9 16 (1.23%) F5
10 13 (1.00%) HP
11 12 (0.92%) Citrix
11 12 (0.92%) Dell
11 12 (0.92%) OpenAI
11 12 (0.92%) Splunk
11 12 (0.92%) Symantec
12 10 (0.77%) Alibaba
13 9 (0.69%) Qualys
14 8 (0.61%) IBM
15 7 (0.54%) Red Hat