Analytical Skills Jobs in London

Analytical Skills
England > London

The table below looks at the prevalence of the term Analytical Skills in permanent job vacancies advertised in London. Included is a benchmarking guide to the salaries offered in vacancies that have cited Analytical Skills over the 6 months to 2 December 2023 with a comparison to the same period over the previous 2 years.

6 months to
2 Dec 2023
Same period 2022 Same period 2021
Rank 19 23 40
Rank change year-on-year +4 +17 +8
Permanent jobs citing Analytical Skills 1,716 4,475 4,032
As % of all permanent jobs advertised in London 9.23% 9.37% 7.80%
As % of the General category 13.58% 13.13% 12.36%
Number of salaries quoted 1,217 2,496 2,323
10th Percentile £40,000 £35,000 £36,750
25th Percentile £51,250 £48,500 £47,500
Median annual salary (50th Percentile) £70,000 £65,000 £62,500
Median % change year-on-year +7.69% +4.00% -3.85%
75th Percentile £86,250 £83,750 £80,000
90th Percentile £115,000 £102,500 £96,250
England median annual salary £57,500 £55,000 £52,500
% change year-on-year +4.55% +4.76% -

All General Skills
London

Analytical Skills is in the General Skills category. The following table is for comparison with the above and provides summary statistics for all permanent job vacancies advertised in London with a requirement for common skills.

Permanent vacancies with a requirement for common skills 12,634 34,083 32,610
As % of all permanent jobs advertised in London 67.99% 71.35% 63.07%
Number of salaries quoted 9,752 22,404 21,051
10th Percentile £40,000 £41,250 £40,500
25th Percentile £55,000 £53,750 £52,500
Median annual salary (50th Percentile) £75,000 £72,500 £70,000
Median % change year-on-year +3.45% +3.57% -
75th Percentile £95,000 £95,000 £91,250
90th Percentile £118,750 £115,000 £112,500
England median annual salary £60,000 £60,000 £60,000
% change year-on-year - - +4.35%

Analytical Skills
Job Vacancy Trend in London

Job postings citing Analytical Skills as a proportion of all IT jobs advertised in London.
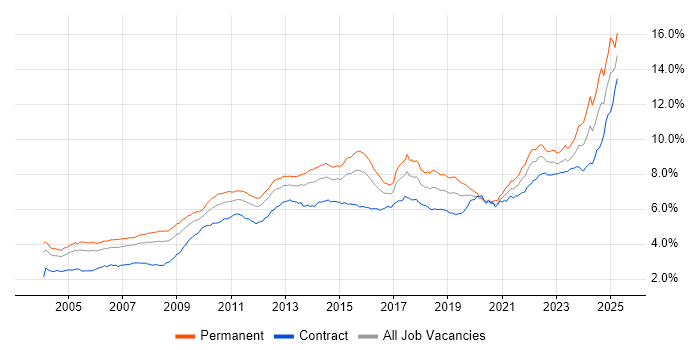
Job vacancy trend for Analytical Skills in London

Analytical Skills
Salary Trend in London

3-month moving average salary quoted in jobs citing Analytical Skills in London.

Salary trend for Analytical Skills in London

Analytical Skills
Salary Histogram in London

Salary distribution for jobs citing Analytical Skills in London over the 6 months to 2 December 2023.

Salary histogram for Analytical Skills in London

Analytical Skills
Job Locations in London

The table below looks at the demand and provides a guide to the median salaries quoted in IT jobs citing Analytical Skills within the London region over the 6 months to 2 December 2023. The 'Rank Change' column provides an indication of the change in demand within each location based on the same 6 month period last year.

Location Rank Change
on Same Period
Last Year
Matching
Permanent
IT Job Ads
Median Salary
Past 6 Months
Median Salary
% Change
on Same Period
Last Year
Live
Jobs
Central London +4 271 £67,500 -6.90% 139
East London +28 54 £76,250 +38.64% 98
West London +21 42 £55,000 +29.41% 59
South London -12 25 £45,000 - 25
North London +10 19 £70,000 +9.80% 12
Analytical Skills
England

Analytical Skills
Co-occurring Skills and Capabilities in London by Category

The follow tables expand on the table above by listing co-occurrences grouped by category. The same employment type, locality and period is covered with up to 20 co-occurrences shown in each of the following categories:

Application Platforms
1 51 (2.97%) SharePoint
2 45 (2.62%) Confluence
3 38 (2.21%) Apache Spark
4 31 (1.81%) SAS
5 15 (0.87%) Apache
6 11 (0.64%) IIS
6 11 (0.64%) MS Exchange
7 9 (0.52%) Apache Airflow
8 8 (0.47%) CMS
9 7 (0.41%) Tomcat
10 5 (0.29%) Drupal
11 2 (0.12%) Exchange Server 2010
11 2 (0.12%) Exchange Server 2013
11 2 (0.12%) Oracle Workflow
11 2 (0.12%) SharePoint 2010
11 2 (0.12%) SharePoint 2013
12 1 (0.058%) Apache TomEE
12 1 (0.058%) Luigi
12 1 (0.058%) Magnolia
12 1 (0.058%) WinCC
Applications
1 176 (10.26%) Microsoft Excel
2 91 (5.30%) Microsoft Office
3 59 (3.44%) Microsoft PowerPoint
4 25 (1.46%) MS Visio
5 13 (0.76%) Microsoft Project
6 3 (0.17%) 3ds Max
6 3 (0.17%) Blender
6 3 (0.17%) Maya
6 3 (0.17%) Spreadsheet
7 2 (0.12%) AutoCAD
7 2 (0.12%) Chatbot
7 2 (0.12%) Sketch
7 2 (0.12%) Trello
8 1 (0.058%) Adobe Creative Suite
8 1 (0.058%) Photoshop
8 1 (0.058%) SPSS
Business Applications
1 21 (1.22%) Dynamics CRM
2 9 (0.52%) Oracle Payables
3 8 (0.47%) Distributed Ledger
4 7 (0.41%) NetSuite
4 7 (0.41%) Oracle Assets
4 7 (0.41%) Oracle General Ledger
5 6 (0.35%) Adaptiv
5 6 (0.35%) Oracle Applications
5 6 (0.35%) SAP S/4HANA
5 6 (0.35%) Workday HCM
6 5 (0.29%) BusinessWorks
6 5 (0.29%) Oracle Receivables
7 4 (0.23%) Dynamics AX
7 4 (0.23%) SAP CX
8 3 (0.17%) Dynamics NAV
8 3 (0.17%) Oracle AGIS
8 3 (0.17%) Oracle E-Business Tax
8 3 (0.17%) Oracle Financials
8 3 (0.17%) Oracle iProcurement
9 2 (0.12%) Shopify
Cloud Services
1 331 (19.29%) Azure
2 274 (15.97%) AWS
3 170 (9.91%) Power Platform
4 125 (7.28%) Microsoft 365
5 105 (6.12%) GCP
6 47 (2.74%) SaaS
7 39 (2.27%) Google Sheets
8 38 (2.21%) Azure DevOps
8 38 (2.21%) Dynamics 365
9 27 (1.57%) Google Analytics
10 26 (1.52%) IaaS
11 25 (1.46%) WhatsApp
12 24 (1.40%) Snowflake
13 22 (1.28%) PaaS
14 21 (1.22%) GitHub
14 21 (1.22%) Power Automate
15 20 (1.17%) PowerApps
16 19 (1.11%) Azure Data Factory
17 18 (1.05%) Cloud Computing
18 17 (0.99%) Amazon S3
Communications & Networking
1 56 (3.26%) Firewall
1 56 (3.26%) VPN
2 44 (2.56%) DNS
3 34 (1.98%) TCP/IP
4 33 (1.92%) WAN
5 31 (1.81%) DHCP
6 28 (1.63%) LAN
7 26 (1.52%) Intranet
7 26 (1.52%) Network Security
8 24 (1.40%) Wireless
9 19 (1.11%) Internet
10 18 (1.05%) SAN
10 18 (1.05%) Unified Communications
11 16 (0.93%) VoIP
12 15 (0.87%) MPLS
12 15 (0.87%) Wi-Fi
13 14 (0.82%) VLAN
13 14 (0.82%) WebEx
14 12 (0.70%) H.323
15 11 (0.64%) BGP
Database & Business Intelligence
1 151 (8.80%) Power BI
2 118 (6.88%) Tableau
3 110 (6.41%) SQL Server
4 72 (4.20%) Data Warehouse
5 57 (3.32%) Data Mining
6 56 (3.26%) Hadoop
7 48 (2.80%) Relational Database
8 44 (2.56%) Elasticsearch
9 41 (2.39%) MongoDB
10 40 (2.33%) Metadata
11 35 (2.04%) PostgreSQL
12 33 (1.92%) Data Lake
12 33 (1.92%) MySQL
13 30 (1.75%) NoSQL
14 29 (1.69%) SQL Server Integration Services
15 27 (1.57%) Amazon QuickSight
15 27 (1.57%) Big Data
16 23 (1.34%) SQL Server Reporting Services
17 20 (1.17%) BigQuery
18 19 (1.11%) Apache Ignite
Development Applications
1 82 (4.78%) JIRA
2 52 (3.03%) Git
3 44 (2.56%) Jenkins
4 15 (0.87%) GitLab
5 12 (0.70%) Bitbucket
6 10 (0.58%) Selenium
7 8 (0.47%) Visual Studio
8 7 (0.41%) Team Foundation Server
9 6 (0.35%) JUnit
9 6 (0.35%) SpecFlow
10 5 (0.29%) Cucumber
11 4 (0.23%) NUnit
11 4 (0.23%) Postman
11 4 (0.23%) SonarQube
11 4 (0.23%) SQL Server Management Studio (SSMS)
11 4 (0.23%) TeamCity
11 4 (0.23%) TestRail
12 3 (0.17%) Appium
12 3 (0.17%) Artifactory
12 3 (0.17%) Maven
General
1 819 (47.73%) Social Skills
2 595 (34.67%) Finance
3 156 (9.09%) Banking
3 156 (9.09%) Marketing
4 111 (6.47%) Inclusion and Diversity
5 104 (6.06%) Retail
6 92 (5.36%) Legal
7 85 (4.95%) Local Government
8 70 (4.08%) Presentation Skills
9 67 (3.90%) Law
10 65 (3.79%) Organisational Skills
11 50 (2.91%) Games
12 47 (2.74%) Front Office
12 47 (2.74%) Investment Banking
13 44 (2.56%) Advertising
14 41 (2.39%) Telecoms
15 38 (2.21%) Influencing Skills
16 37 (2.16%) Public Sector
17 36 (2.10%) French Language
18 35 (2.04%) Financial Institution
Job Titles
1 531 (30.94%) Analyst
2 274 (15.97%) Senior
3 177 (10.31%) Developer
4 126 (7.34%) Architect
5 116 (6.76%) Lead
6 97 (5.65%) Business Analyst
7 81 (4.72%) Operations Analyst
8 80 (4.66%) Digital Analyst
9 78 (4.55%) Consultant
10 75 (4.37%) Data Analyst
11 73 (4.25%) Senior Analyst
12 71 (4.14%) Data Engineer
13 60 (3.50%) Solutions Architect
14 58 (3.38%) IT Analyst
15 53 (3.09%) Java Developer
16 43 (2.51%) Product Manager
17 40 (2.33%) Support Analyst
18 38 (2.21%) IT Support
19 37 (2.16%) Data Architect
20 36 (2.10%) Systems Analyst
Libraries, Frameworks & Software Standards
1 76 (4.43%) HTML
2 61 (3.55%) .NET
3 54 (3.15%) React
4 52 (3.03%) REST
5 42 (2.45%) CSS
6 41 (2.39%) Kafka
7 34 (1.98%) Spring
8 30 (1.75%) Qt
9 26 (1.52%) Web Services
10 21 (1.22%) XML
11 20 (1.17%) AngularJS
12 19 (1.11%) ASP.NET
13 16 (0.93%) EDI
14 15 (0.87%) SOAP
15 14 (0.82%) JSON
15 14 (0.82%) RESTful
16 13 (0.76%) Flask
16 13 (0.76%) Pandas
17 12 (0.70%) Middleware
18 10 (0.58%) YAML
Miscellaneous
1 130 (7.58%) Management Information System
2 94 (5.48%) Product Ownership
3 78 (4.55%) Onboarding
4 75 (4.37%) Self-Motivation
5 73 (4.25%) Analytical Mindset
6 59 (3.44%) Greenfield Project
7 38 (2.21%) Algorithms
8 36 (2.10%) Cloud Native
9 28 (1.63%) Hedge funds
10 26 (1.52%) Cyberattack
10 26 (1.52%) Data Structures
11 24 (1.40%) Credit Risk
11 24 (1.40%) Sports Betting
12 23 (1.34%) Video Conferencing
13 19 (1.11%) Data Centre
13 19 (1.11%) Equities
13 19 (1.11%) Replication
14 18 (1.05%) Distributed Systems
14 18 (1.05%) Enterprise Software
15 17 (0.99%) Public Cloud
Operating Systems
1 142 (8.28%) Windows
2 62 (3.61%) Linux
3 54 (3.15%) Windows 10
4 46 (2.68%) Windows Server
5 26 (1.52%) Unix
6 17 (0.99%) Mac OS
7 9 (0.52%) Red Hat Enterprise Linux
7 9 (0.52%) Windows Server 2012
8 7 (0.41%) Windows 7
8 7 (0.41%) Windows Server 2008
8 7 (0.41%) Windows Server 2016
9 3 (0.17%) Android
9 3 (0.17%) CentOS
9 3 (0.17%) HPUX
9 3 (0.17%) Solaris
9 3 (0.17%) SUSE
9 3 (0.17%) Windows Server 2003
9 3 (0.17%) Windows Server 2019
9 3 (0.17%) Windows XP
10 2 (0.12%) Debian
Processes & Methodologies
1 777 (45.28%) Problem-Solving
2 434 (25.29%) Agile
3 286 (16.67%) Analytics
4 261 (15.21%) Project Management
5 242 (14.10%) Decision-Making
6 214 (12.47%) Business Intelligence
7 205 (11.95%) Computer Science
8 192 (11.19%) Customer Service
9 187 (10.90%) Roadmaps
10 159 (9.27%) Mentoring
11 157 (9.15%) Visualisation
12 152 (8.86%) Stakeholder Management
13 146 (8.51%) Artificial Intelligence
14 144 (8.39%) Continuous Improvement
15 140 (8.16%) Data Modelling
16 139 (8.10%) Data Analysis
17 137 (7.98%) User Experience
18 133 (7.75%) DevOps
19 129 (7.52%) Data Visualisation
20 123 (7.17%) Data Science
Programming Languages
1 404 (23.54%) SQL
2 275 (16.03%) Python
3 126 (7.34%) Java
4 87 (5.07%) JavaScript
5 78 (4.55%) R
6 74 (4.31%) C#
6 74 (4.31%) PowerShell
7 67 (3.90%) C++
8 31 (1.81%) Bash
9 27 (1.57%) VBA
10 23 (1.34%) T-SQL
11 20 (1.17%) Go
12 18 (1.05%) MATLAB
13 15 (0.87%) Scala
14 11 (0.64%) TypeScript
15 10 (0.58%) C
15 10 (0.58%) Data Analysis Expressions
15 10 (0.58%) PL/SQL
16 9 (0.52%) Ruby
17 7 (0.41%) VB
Qualifications
1 557 (32.46%) Degree
2 150 (8.74%) Computer Science Degree
3 102 (5.94%) Master's Degree
4 73 (4.25%) Security Cleared
5 41 (2.39%) CISSP
6 40 (2.33%) DV Cleared
7 38 (2.21%) CISM
8 30 (1.75%) Cisco Certification
9 24 (1.40%) CRISC
10 23 (1.34%) CISA
10 23 (1.34%) SC Cleared
11 19 (1.11%) ISACA
11 19 (1.11%) Microsoft Certification
12 18 (1.05%) Azure Certification
13 17 (0.99%) CCNA
14 13 (0.76%) CCNP
14 13 (0.76%) TOGAF Certification
15 12 (0.70%) AWS Certification
16 11 (0.64%) PMI Certification
17 10 (0.58%) Numerate Degree
Quality Assurance & Compliance
1 116 (6.76%) Data Quality
2 59 (3.44%) QA
3 41 (2.39%) SLA
4 40 (2.33%) PMO
5 31 (1.81%) NIST
6 23 (1.34%) GDPR
7 22 (1.28%) ISO/IEC 27001
8 18 (1.05%) GRC
9 13 (0.76%) Accessibility
10 11 (0.64%) Actionable Recommendations
11 7 (0.41%) ISO 22301
11 7 (0.41%) Sarbanes-Oxley
12 5 (0.29%) COBIT
12 5 (0.29%) PCI DSS
12 5 (0.29%) WCAG
13 4 (0.23%) Cyber Essentials
14 3 (0.17%) Basel III
15 2 (0.12%) CRD IV
15 2 (0.12%) GAAP
15 2 (0.12%) HIPAA
System Software
1 77 (4.49%) Active Directory
2 45 (2.62%) Docker
3 36 (2.10%) VMware Infrastructure
4 15 (0.87%) VMware ESXi
5 14 (0.82%) Hyper-V
6 12 (0.70%) Virtual Machines
7 6 (0.35%) vSphere
8 5 (0.29%) Virtual Desktop
8 5 (0.29%) XenApp
9 3 (0.17%) vCloud
9 3 (0.17%) Virtual Servers
9 3 (0.17%) VMware NSX
9 3 (0.17%) XenDesktop
10 2 (0.12%) Microsoft Virtual Server
11 1 (0.058%) Apache ZooKeeper
11 1 (0.058%) EMC RecoverPoint
11 1 (0.058%) Firmware
11 1 (0.058%) HDFS
11 1 (0.058%) OpenAM
Systems Management
1 51 (2.97%) Kubernetes
2 45 (2.62%) SCCM
3 35 (2.04%) Terraform
4 30 (1.75%) Microsoft Intune
5 26 (1.52%) Ansible
6 18 (1.05%) Cisco CUCM
7 13 (0.76%) Cisco UCCX
8 12 (0.70%) Cisco Prime
9 9 (0.52%) Puppet
10 8 (0.47%) Nagios
11 6 (0.35%) Control-M
11 6 (0.35%) Oracle Enterprise Manager
11 6 (0.35%) Packer
11 6 (0.35%) Progress Chef
11 6 (0.35%) SafeCom
12 4 (0.23%) FortiGate
12 4 (0.23%) HP ALM
12 4 (0.23%) Single Sign-On
12 4 (0.23%) vCenter Server
12 4 (0.23%) VxRail
Vendors
1 341 (19.87%) Microsoft
2 132 (7.69%) Google
3 80 (4.66%) Oracle
4 69 (4.02%) VMware
5 52 (3.03%) Cisco
6 43 (2.51%) HP
7 41 (2.39%) SAP
8 38 (2.21%) Salesforce
9 35 (2.04%) Capita
10 32 (1.86%) Dell
10 32 (1.86%) ServiceNow
11 29 (1.69%) Bloomberg
12 26 (1.52%) Databricks
13 21 (1.22%) Adobe
13 21 (1.22%) Citrix
14 15 (0.87%) SolarWinds
15 14 (0.82%) Palo Alto
16 12 (0.70%) YouTube
17 11 (0.64%) IBM
17 11 (0.64%) Juniper