JavaScript Jobs in London

JavaScript (including ECMAScript)
England > London

The following table provides summary statistics for permanent job vacancies advertised in London with a requirement for JavaScript skills. Included is a benchmarking guide to the salaries offered in vacancies that have cited JavaScript over the 6 months to 27 April 2024 with a comparison to the same period in the previous 2 years.

6 months to
27 Apr 2024
Same period 2023 Same period 2022
Rank 22 14 9
Rank change year-on-year -8 -5 -1
Permanent jobs citing JavaScript 1,929 4,460 12,613
As % of all permanent jobs advertised in London 8.22% 12.45% 19.30%
As % of the Programming Languages category 20.53% 25.13% 32.18%
Number of salaries quoted 1,640 2,996 5,228
10th Percentile £47,500 £48,750 £46,250
25th Percentile £60,000 £58,750 £56,250
Median annual salary (50th Percentile) £80,000 £75,000 £75,000
Median % change year-on-year +6.67% - +7.14%
75th Percentile £110,000 £95,000 £96,250
90th Percentile £142,500 £117,236 £120,000
England median annual salary £60,000 £65,000 £60,000
% change year-on-year -7.69% +8.33% +9.09%

All Programming Languages
London

JavaScript is in the Programming Languages category. The following table is for comparison with the above and provides summary statistics for all permanent job vacancies advertised in London with a requirement for coding skills.

Permanent vacancies with a requirement for coding skills 9,397 17,750 39,197
As % of all permanent jobs advertised in London 40.03% 49.56% 59.98%
Number of salaries quoted 7,589 13,079 19,238
10th Percentile £47,500 £48,750 £46,250
25th Percentile £60,000 £60,000 £56,250
Median annual salary (50th Percentile) £80,000 £80,000 £75,000
Median % change year-on-year - +6.67% +7.14%
75th Percentile £101,250 £100,000 £95,000
90th Percentile £127,500 £120,000 £115,000
England median annual salary £60,000 £65,000 £62,500
% change year-on-year -7.69% +4.00% +8.70%

JavaScript
Job Vacancy Trend in London

Job postings citing JavaScript as a proportion of all IT jobs advertised in London.
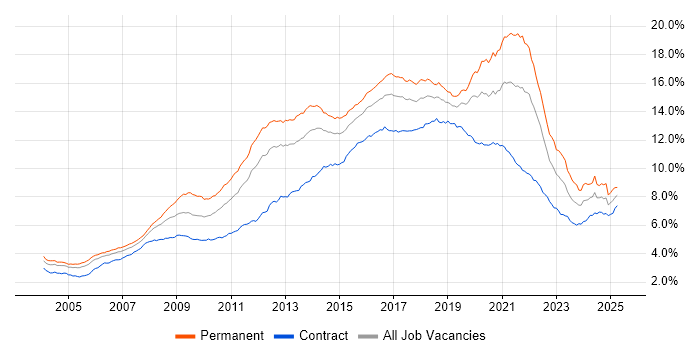
Job vacancy trend for JavaScript in London

JavaScript
Salary Trend in London

3-month moving average salary quoted in jobs citing JavaScript in London.

Salary trend for JavaScript in London

JavaScript
Salary Histogram in London

Salary distribution for jobs citing JavaScript in London over the 6 months to 27 April 2024.

Salary histogram for JavaScript in London

JavaScript
Job Locations in London

The table below looks at the demand and provides a guide to the median salaries quoted in IT jobs citing JavaScript within the London region over the 6 months to 27 April 2024. The 'Rank Change' column provides an indication of the change in demand within each location based on the same 6 month period last year.

Location Rank Change
on Same Period
Last Year
Matching
Permanent
IT Job Ads
Median Salary
Past 6 Months
Median Salary
% Change
on Same Period
Last Year
Live
Jobs
Central London -2 296 £75,000 - 81
South London -33 54 £76,250 +1.67% 2
North London +14 21 £55,000 -15.38% 2
East London +24 15 £72,500 +5.45% 16
West London -69 14 £67,500 +17.39% 14
JavaScript
England

JavaScript
Co-occurring Skills and Capabilities in London by Category

The follow tables expand on the table above by listing co-occurrences grouped by category. The same employment type, locality and period is covered with up to 20 co-occurrences shown in each of the following categories:

Application Platforms
1 229 (11.87%) Apache Airflow
2 187 (9.69%) Apache
3 47 (2.44%) CMS
4 43 (2.23%) SharePoint
5 35 (1.81%) WordPress
6 28 (1.45%) ArcGIS
7 27 (1.40%) GeoServer
8 26 (1.35%) OpenStack
9 24 (1.24%) Confluence
9 24 (1.24%) nginx
10 22 (1.14%) IIS
11 20 (1.04%) Microsoft Exchange
12 15 (0.78%) Drupal
13 14 (0.73%) JBoss
13 14 (0.73%) Tomcat
14 11 (0.57%) Red Hat Fuse
15 10 (0.52%) Adobe Experience Manager
15 10 (0.52%) Moodle
16 7 (0.36%) Sitecore CMS
16 7 (0.36%) Umbraco
Applications
1 17 (0.88%) Microsoft Office
2 16 (0.83%) Microsoft Excel
2 16 (0.83%) Photoshop
3 15 (0.78%) Adobe XD
4 3 (0.16%) Microsoft PowerPoint
4 3 (0.16%) Sketch
5 1 (0.052%) Chatbot
5 1 (0.052%) InVision
5 1 (0.052%) Notion
5 1 (0.052%) UXPin
5 1 (0.052%) Zeplin
Business Applications
1 39 (2.02%) Dynamics CRM
2 29 (1.50%) Remedy ITSM
3 22 (1.14%) SDL Web 8
4 16 (0.83%) Fidessa
5 13 (0.67%) Adobe Campaign
6 9 (0.47%) Elite 3E
7 6 (0.31%) BusinessWorks
8 4 (0.21%) CiviCRM
9 3 (0.16%) Oracle Cash Management
9 3 (0.16%) R3 Corda
9 3 (0.16%) Shopify
10 2 (0.10%) Distributed Ledger
10 2 (0.10%) SAP GRC
11 1 (0.052%) Dynamics NAV
11 1 (0.052%) JDE EnterpriseOne
Cloud Services
1 771 (39.97%) AWS
2 638 (33.07%) Azure
3 320 (16.59%) GCP
4 201 (10.42%) dbt
5 187 (9.69%) Snowflake
6 140 (7.26%) Serverless
7 115 (5.96%) Azure DevOps
8 112 (5.81%) Power Platform
9 99 (5.13%) SaaS
10 74 (3.84%) Dynamics 365
11 66 (3.42%) GitHub
12 60 (3.11%) PowerApps
13 50 (2.59%) Amazon EKS
14 44 (2.28%) AWS Lambda
15 41 (2.13%) Amazon ECS
15 41 (2.13%) Power Automate
16 36 (1.87%) Azure Service Bus
17 31 (1.61%) Azure Logic Apps
18 27 (1.40%) Azure Functions
19 23 (1.19%) Microsoft 365
Communications & Networking
1 25 (1.30%) DNS
1 25 (1.30%) Firewall
1 25 (1.30%) TCP/IP
2 22 (1.14%) Internet
3 18 (0.93%) DHCP
4 16 (0.83%) FIX Connectivity
5 13 (0.67%) SSL
6 12 (0.62%) VPN
7 11 (0.57%) HTTP
8 7 (0.36%) AMQP
8 7 (0.36%) OpenVPN
9 6 (0.31%) Network Security
10 3 (0.16%) VoIP
11 2 (0.10%) HTTPS
12 1 (0.052%) FTP
12 1 (0.052%) Kerberos
12 1 (0.052%) LAN
12 1 (0.052%) Reverse Proxy
12 1 (0.052%) SMS
12 1 (0.052%) WAN
Database & Business Intelligence
1 336 (17.42%) SQL Server
2 201 (10.42%) Amazon Athena
2 201 (10.42%) Apache Arrow
2 201 (10.42%) Dremio
3 172 (8.92%) Apache Ignite
4 167 (8.66%) Data Lake
5 154 (7.98%) PostgreSQL
6 108 (5.60%) MongoDB
7 97 (5.03%) Relational Database
8 96 (4.98%) NoSQL
9 79 (4.10%) MySQL
10 54 (2.80%) Elasticsearch
11 49 (2.54%) Power BI
12 36 (1.87%) Big Data
13 33 (1.71%) GIS
14 28 (1.45%) Tableau
15 27 (1.40%) QGIS
16 25 (1.30%) Oracle Database
17 22 (1.14%) Azure SQL Database
18 20 (1.04%) SQL Server Integration Services
Development Applications
1 259 (13.43%) Git
2 124 (6.43%) Jenkins
3 79 (4.10%) JIRA
4 58 (3.01%) Cypress.io
5 34 (1.76%) Cucumber
6 32 (1.66%) TeamCity
6 32 (1.66%) Visual Studio
7 31 (1.61%) NUnit
8 29 (1.50%) Selenium
9 27 (1.40%) Oracle APEX
10 26 (1.35%) GitLab
11 25 (1.30%) Moq
12 24 (1.24%) JUnit
13 17 (0.88%) Maven
14 16 (0.83%) Postman
15 15 (0.78%) Octopus Deploy
16 14 (0.73%) Axure RP
16 14 (0.73%) Sourcetree
16 14 (0.73%) SpecFlow
17 13 (0.67%) Balsamiq
General
1 661 (34.27%) Finance
2 368 (19.08%) Social Skills
3 347 (17.99%) Front Office
4 253 (13.12%) Banking
5 180 (9.33%) Investment Banking
6 133 (6.89%) Marketing
7 100 (5.18%) Analytical Skills
8 92 (4.77%) Public Sector
9 67 (3.47%) Inclusion and Diversity
10 50 (2.59%) Law
11 49 (2.54%) Back Office
12 41 (2.13%) Retail
13 39 (2.02%) Legal
13 39 (2.02%) Tech for Good
14 32 (1.66%) Financial Institution
15 28 (1.45%) Presentation Skills
16 22 (1.14%) Games
16 22 (1.14%) Health Technology
17 20 (1.04%) Publishing
18 17 (0.88%) Electronics
Job Titles
1 1,188 (61.59%) Developer
2 571 (29.60%) Senior
3 365 (18.92%) Software Engineer
4 356 (18.46%) Senior Developer
5 296 (15.34%) Full Stack Developer
6 285 (14.77%) .NET Developer
7 234 (12.13%) Lead
8 192 (9.95%) Developer/Software Engineer
9 148 (7.67%) Senior Software Engineer
10 129 (6.69%) C# Developer
10 129 (6.69%) Java Developer
11 122 (6.32%) Software Developer
12 120 (6.22%) Architect
13 106 (5.50%) Lead Developer
14 103 (5.34%) AWS Engineer
15 102 (5.29%) .NET Software Engineer
16 101 (5.24%) React Developer
17 97 (5.03%) .NET Software Developer
18 96 (4.98%) Senior Software Developer
19 93 (4.82%) Senior Full Stack Developer
Libraries, Frameworks & Software Standards
1 741 (38.41%) React
2 653 (33.85%) HTML
3 622 (32.24%) .NET
4 603 (31.26%) CSS
5 554 (28.72%) AngularJS
6 318 (16.49%) Node.js
7 274 (14.20%) .NET Core
8 260 (13.48%) Vue
9 258 (13.37%) ASP.NET
10 233 (12.08%) gRPC
11 225 (11.66%) Protocol Buffers
12 205 (10.63%) Web Services
13 204 (10.58%) REST
14 189 (9.80%) Redux
15 183 (9.49%) Pandas
16 174 (9.02%) HTML5
17 170 (8.81%) RESTful
18 168 (8.71%) NumPy
19 163 (8.45%) .NET Framework
20 162 (8.40%) SciPy
Miscellaneous
1 312 (16.17%) Fixed Income
2 299 (15.50%) Hedge funds
3 287 (14.88%) Foreign Exchange (FX)
4 268 (13.89%) Equities
5 259 (13.43%) Derivative
6 113 (5.86%) Greenfield Project
7 90 (4.67%) Distributed Systems
8 65 (3.37%) Cloud Native
9 60 (3.11%) Product Ownership
10 59 (3.06%) Data Structures
11 49 (2.54%) Client/Server
12 39 (2.02%) Legacy Code
13 34 (1.76%) Clustering
14 31 (1.61%) Mobile App
15 29 (1.50%) CMDB
16 27 (1.40%) Algorithms
16 27 (1.40%) IoT
17 21 (1.09%) Legacy Systems
17 21 (1.09%) Self-Motivation
18 20 (1.04%) Life Science
Operating Systems
1 107 (5.55%) Linux
2 67 (3.47%) Windows
3 34 (1.76%) Android
4 33 (1.71%) Unix
5 31 (1.61%) Apple iOS
6 23 (1.19%) CentOS
7 15 (0.78%) Ubuntu
8 12 (0.62%) Solaris
9 6 (0.31%) Windows Server
10 3 (0.16%) Windows 10
11 2 (0.10%) Red Hat Enterprise Linux
11 2 (0.10%) Windows Server 2012
11 2 (0.10%) Windows Server 2016
11 2 (0.10%) Windows Server 2019
12 1 (0.052%) Mac OS
12 1 (0.052%) VMS
Processes & Methodologies
1 872 (45.20%) Agile
2 633 (32.81%) Software Engineering
3 626 (32.45%) Full Stack Development
4 389 (20.17%) Asset Management
5 382 (19.80%) DevOps
6 305 (15.81%) Investment Management
7 291 (15.09%) Microservices
8 254 (13.17%) Problem-Solving
9 232 (12.03%) TDD
10 217 (11.25%) Computer Science
11 207 (10.73%) Mentoring
12 204 (10.58%) MVC
13 193 (10.01%) CI/CD
14 186 (9.64%) Fintech
15 181 (9.38%) Scrum
16 165 (8.55%) Analytics
17 163 (8.45%) Web Development
18 159 (8.24%) Front End Development
19 138 (7.15%) User Experience
20 137 (7.10%) Test Automation
Programming Languages
1 709 (36.75%) TypeScript
2 662 (34.32%) Python
3 659 (34.16%) C#
4 531 (27.53%) Java
5 513 (26.59%) SQL
6 97 (5.03%) PHP
6 97 (5.03%) T-SQL
7 83 (4.30%) Ruby
8 79 (4.10%) Go
9 67 (3.47%) PowerShell
10 52 (2.70%) Kotlin
11 45 (2.33%) Bash
12 35 (1.81%) Perl
13 33 (1.71%) PL/SQL
14 24 (1.24%) Scala
15 20 (1.04%) Shell Script
15 20 (1.04%) XPath
16 18 (0.93%) C++
17 16 (0.83%) Apex Code
18 15 (0.78%) C
Qualifications
1 331 (17.16%) Degree
2 146 (7.57%) Security Cleared
3 107 (5.55%) Computer Science Degree
4 99 (5.13%) SC Cleared
5 23 (1.19%) Microsoft Certification
6 21 (1.09%) CTC Cleared
7 19 (0.98%) AWS Certification
8 18 (0.93%) Master's Degree
9 15 (0.78%) Azure Certification
10 10 (0.52%) AWS Certified Developer
10 10 (0.52%) DV Cleared
11 9 (0.47%) AWS Certified Solutions Architect
11 9 (0.47%) ITIL Foundation Certificate
11 9 (0.47%) Postgraduate
12 5 (0.26%) PhD
13 3 (0.16%) BPSS Clearance
13 3 (0.16%) DBS Check
14 2 (0.10%) ISO 27001 Lead Auditor
14 2 (0.10%) ITIL Certification
15 1 (0.052%) Numerate Degree
Quality Assurance & Compliance
1 129 (6.69%) QA
2 63 (3.27%) Data Quality
3 29 (1.50%) Accessibility
3 29 (1.50%) SLA
4 24 (1.24%) WCAG
5 13 (0.67%) ISO/IEC 27001
6 7 (0.36%) GDPR
7 6 (0.31%) Cyber Essentials
8 5 (0.26%) PMO
9 4 (0.21%) PCI DSS
10 3 (0.16%) ISO 9000
11 2 (0.10%) GRC
11 2 (0.10%) HIPAA
11 2 (0.10%) IEC 62304
11 2 (0.10%) ISO 13485
11 2 (0.10%) ISO 9001
11 2 (0.10%) WAI
12 1 (0.052%) Good Clinical Practice
System Software
1 176 (9.12%) Docker
2 13 (0.67%) Hyper-V
2 13 (0.67%) VMware Infrastructure
3 8 (0.41%) KVM
4 6 (0.31%) Active Directory
5 4 (0.21%) vSphere
6 2 (0.10%) Embedded Firmware
6 2 (0.10%) Firmware
6 2 (0.10%) OpenSIPS
6 2 (0.10%) Virtual Machines
7 1 (0.052%) ACF2
7 1 (0.052%) IAG
7 1 (0.052%) OpenAM
7 1 (0.052%) OpenDJ
7 1 (0.052%) RACF
7 1 (0.052%) Virtual Desktop
Systems Management
1 205 (10.63%) Kubernetes
2 90 (4.67%) Terraform
3 49 (2.54%) Ansible
4 38 (1.97%) Prometheus
5 20 (1.04%) Grafana
6 18 (0.93%) Single Sign-On
7 8 (0.41%) Active Directory Federation Services
7 8 (0.41%) HP UCMDB
8 7 (0.36%) Kibana
9 6 (0.31%) CloudHub
10 4 (0.21%) logstash
10 4 (0.21%) Progress Chef
10 4 (0.21%) Puppet
10 4 (0.21%) vRealize
10 4 (0.21%) vRealize Orchestrator
11 3 (0.16%) Istio
12 2 (0.10%) Consul
12 2 (0.10%) Failover Clustering
12 2 (0.10%) RSA Archer
12 2 (0.10%) ZABBIX
Vendors
1 316 (16.38%) Microsoft
2 104 (5.39%) Oracle
3 70 (3.63%) ServiceNow
4 53 (2.75%) Adobe
5 49 (2.54%) Google
6 31 (1.61%) Red Hat
7 29 (1.50%) BMC
7 29 (1.50%) ESRI
7 29 (1.50%) HP
7 29 (1.50%) Remedy
8 26 (1.35%) WSO2
9 21 (1.09%) Salesforce
10 16 (0.83%) Bloomberg
10 16 (0.83%) CQG
10 16 (0.83%) IBM
10 16 (0.83%) ION Trading
10 16 (0.83%) Patsystems
10 16 (0.83%) Reuters
10 16 (0.83%) Trayport
11 15 (0.78%) Atlassian