Marketing Jobs in London

Marketing
England > London

The table below looks at the prevalence of the term Marketing in permanent job vacancies in London. Included is a benchmarking guide to the salaries offered in vacancies that cited Marketing over the 6 months leading up to 20 January 2025, comparing them to the same period in the previous two years.

6 months to
20 Jan 2025
Same period 2024 Same period 2023
Rank 50 59 46
Rank change year-on-year +9 -13 +11
Permanent jobs citing Marketing 924 867 2,530
As % of all permanent jobs advertised in London 5.50% 4.48% 6.28%
As % of the General category 7.38% 6.82% 8.87%
Number of salaries quoted 297 603 1,339
10th Percentile £39,000 £37,500 £40,000
25th Percentile £52,500 £46,250 £50,000
Median annual salary (50th Percentile) £72,500 £65,000 £67,500
Median % change year-on-year +11.54% -3.70% +8.00%
75th Percentile £95,000 £85,000 £87,500
90th Percentile £115,000 £115,000 £105,000
England median annual salary £62,500 £50,000 £58,500
% change year-on-year +25.00% -14.53% +6.36%

All General Skills
London

Marketing falls under the General Skills category. For comparison with the information above, the following table provides summary statistics for all permanent job vacancies requiring common skills in London.

Permanent vacancies with a requirement for common skills 12,525 12,714 28,534
As % of all permanent jobs advertised in London 74.56% 65.66% 70.82%
Number of salaries quoted 5,975 9,737 20,051
10th Percentile £42,600 £39,085 £42,500
25th Percentile £56,250 £55,000 £55,000
Median annual salary (50th Percentile) £75,000 £75,000 £74,000
Median % change year-on-year - +1.35% +5.71%
75th Percentile £100,000 £95,000 £95,000
90th Percentile £122,500 £117,500 £115,000
England median annual salary £60,000 £57,500 £62,500
% change year-on-year +4.35% -8.00% +4.17%

Marketing
Job Vacancy Trend in London

Job postings citing Marketing as a proportion of all IT jobs advertised in London.
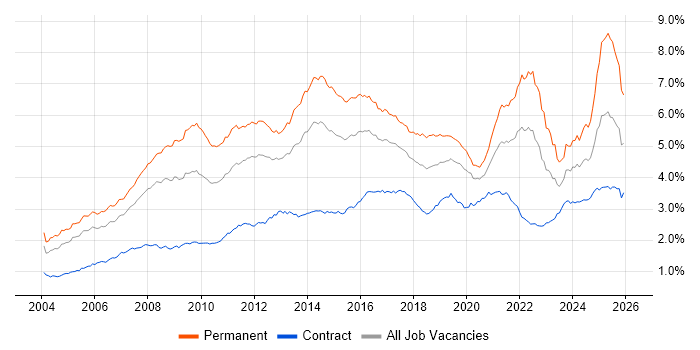
Job vacancy trend for Marketing in London

Marketing
Salary Trend in London

3-month moving average salary quoted in jobs citing Marketing in London.

Salary trend for Marketing in London

Marketing
Salary Histogram in London

Salary distribution for jobs citing Marketing in London over the 6 months to 20 January 2025.

Salary histogram for Marketing in London

Marketing
Job Locations in London

The table below looks at the demand and provides a guide to the median salaries quoted in IT jobs citing Marketing within the London region over the 6 months to 20 January 2025. The 'Rank Change' column provides an indication of the change in demand within each location based on the same 6 month period last year.

Location Rank Change
on Same Period
Last Year
Matching
Permanent
IT Job Ads
Median Salary
Past 6 Months
Median Salary
% Change
on Same Period
Last Year
Live
Jobs
Central London +22 124 £83,750 +4.69% 95
South London 0 59 £36,547 -26.91% 10
West London -27 34 £72,500 +7.41% 40
North London +8 22 £60,000 -27.27% 3
Marketing
England

Marketing
Co-occurring Skills and Capabilities in London by Category

The follow tables expand on the table above by listing co-occurrences grouped by category. The same employment type, locality and period is covered with up to 20 co-occurrences shown in each of the following categories:

Application Platforms
1 56 (6.06%) CMS
2 27 (2.92%) Confluence
3 19 (2.06%) WordPress
4 8 (0.87%) Adobe Experience Manager
4 8 (0.87%) Sitecore CMS
5 7 (0.76%) SharePoint
6 6 (0.65%) Drupal
7 3 (0.32%) Microsoft Exchange
7 3 (0.32%) SAS
8 2 (0.22%) Apache Airflow
8 2 (0.22%) Ethereum
8 2 (0.22%) SharePoint Server
9 1 (0.11%) Apache
9 1 (0.11%) Apache Spark
9 1 (0.11%) Oracle SOA Suite
Applications
1 47 (5.09%) Microsoft Excel
2 41 (4.44%) Microsoft Office
3 40 (4.33%) Photoshop
4 32 (3.46%) Adobe Creative Suite
5 27 (2.92%) Microsoft PowerPoint
6 24 (2.60%) Adobe Illustrator
7 21 (2.27%) Adobe Premiere
8 19 (2.06%) InDesign
9 18 (1.95%) Adobe After Effects
9 18 (1.95%) Chatbot
10 9 (0.97%) CapCut
11 5 (0.54%) Adobe XD
11 5 (0.54%) InVision
11 5 (0.54%) Sketch
12 4 (0.43%) Final Cut Pro
12 4 (0.43%) Maya
12 4 (0.43%) MS Visio
12 4 (0.43%) QuarkXPress
12 4 (0.43%) Trello
12 4 (0.43%) Zeplin
Business Applications
1 35 (3.79%) Dynamics CRM
2 10 (1.08%) Adobe Campaign
3 8 (0.87%) Academy Revenues and Benefits
4 6 (0.65%) Shopify
5 4 (0.43%) Raiser’s Edge
5 4 (0.43%) Salesforce CRM
6 2 (0.22%) NetSuite
6 2 (0.22%) Oracle EBS
6 2 (0.22%) Sparx Enterprise Architect
7 1 (0.11%) Distributed Ledger
7 1 (0.11%) Finacle
7 1 (0.11%) Oracle Applications
7 1 (0.11%) Oracle Assets
7 1 (0.11%) Oracle Cash Management
7 1 (0.11%) Oracle E-Business Tax
7 1 (0.11%) Oracle Financials
7 1 (0.11%) Oracle General Ledger
7 1 (0.11%) Oracle Payables
7 1 (0.11%) Oracle Receivables
7 1 (0.11%) Payment Gateway
Cloud Services
1 141 (15.26%) AWS
2 97 (10.50%) Serverless
3 95 (10.28%) GitHub
4 93 (10.06%) Amazon S3
5 92 (9.96%) AWS Lambda
6 88 (9.52%) Amazon Kinesis
6 88 (9.52%) Amazon SQS
7 83 (8.98%) Azure
8 74 (8.01%) Power Platform
9 57 (6.17%) GCP
9 57 (6.17%) SaaS
10 50 (5.41%) Google Analytics
11 37 (4.00%) Dynamics 365
12 30 (3.25%) Power Automate
12 30 (3.25%) PowerApps
13 29 (3.14%) Google Ads
14 25 (2.71%) Cloud Computing
15 19 (2.06%) Canva
16 14 (1.52%) Salesforce Sales Cloud
16 14 (1.52%) Salesforce Service Cloud
Communications & Networking
1 59 (6.39%) Broadband
2 24 (2.60%) Wireshark
3 12 (1.30%) SMS
4 10 (1.08%) Internet
4 10 (1.08%) Network Security
5 8 (0.87%) WPA
6 7 (0.76%) Wi-Fi
7 5 (0.54%) Wireless
8 4 (0.43%) 4G
8 4 (0.43%) 5G
9 2 (0.22%) Firewall
9 2 (0.22%) Intrusion Detection
10 1 (0.11%) DHCP
10 1 (0.11%) DNS
10 1 (0.11%) FTP
10 1 (0.11%) Intranet
10 1 (0.11%) PPP
10 1 (0.11%) TCP/IP
Database & Business Intelligence
1 106 (11.47%) PostgreSQL
2 90 (9.74%) DynamoDB
3 89 (9.63%) Redis
4 74 (8.01%) Tableau
5 50 (5.41%) Power BI
6 25 (2.71%) Big Data
7 23 (2.49%) BigQuery
8 19 (2.06%) Data Warehouse
9 15 (1.62%) Data Lake
10 14 (1.52%) MySQL
11 13 (1.41%) SQL Server
12 12 (1.30%) Looker
13 11 (1.19%) Metadata
13 11 (1.19%) Relational Database
14 10 (1.08%) Amazon Redshift
15 8 (0.87%) Data Mining
15 8 (0.87%) SQL Server Reporting Services
16 7 (0.76%) Azure SQL Database
16 7 (0.76%) NoSQL
17 5 (0.54%) Azure SQL Data Warehouse
Development Applications
1 89 (9.63%) Jenkins
2 24 (2.60%) Fiddler
3 17 (1.84%) Git
4 15 (1.62%) JIRA
5 10 (1.08%) Robot Framework
6 4 (0.43%) Bitbucket
6 4 (0.43%) Crucible
6 4 (0.43%) Grunt
6 4 (0.43%) gulp
7 3 (0.32%) Team Foundation Server
8 2 (0.22%) CircleCI
8 2 (0.22%) Cypress.io
9 1 (0.11%) Axure RP
9 1 (0.11%) git-flow
9 1 (0.11%) GitLab
9 1 (0.11%) JMeter
9 1 (0.11%) MLflow
9 1 (0.11%) Selenium
9 1 (0.11%) Sourcetree
9 1 (0.11%) Visual Studio Tools for Office
General
1 364 (39.39%) Social Skills
2 209 (22.62%) Advertising
3 203 (21.97%) Analytical Skills
3 203 (21.97%) Finance
4 171 (18.51%) Inclusion and Diversity
5 65 (7.03%) Presentation Skills
6 54 (5.84%) Public Sector
6 54 (5.84%) Retail
7 53 (5.74%) Organisational Skills
8 51 (5.52%) Legal
8 51 (5.52%) Telecoms
9 49 (5.30%) Banking
10 48 (5.19%) Manufacturing
11 34 (3.68%) Influencing Skills
11 34 (3.68%) Law
12 26 (2.81%) Publishing
13 25 (2.71%) Electronics
14 24 (2.60%) Brand Awareness
15 19 (2.06%) Games
16 11 (1.19%) Pharmaceutical
Job Titles
1 146 (15.80%) Senior
2 93 (10.06%) Software Engineer
3 72 (7.79%) Consultant
4 71 (7.68%) Analyst
5 58 (6.28%) Development Manager
6 50 (5.41%) Architect
7 48 (5.19%) Developer
8 41 (4.44%) Senior Manager
9 37 (4.00%) Business Manager
10 35 (3.79%) Product Manager
11 34 (3.68%) Business Development Manager
12 29 (3.14%) Lead
13 28 (3.03%) Service Delivery Executive
14 26 (2.81%) Senior Analyst
14 26 (2.81%) SEO Specialist
15 24 (2.60%) Project Manager
16 23 (2.49%) Senior Product Manager
17 21 (2.27%) Designer
18 20 (2.16%) Coordinator
19 18 (1.95%) Performance Manager
Libraries, Frameworks & Software Standards
1 110 (11.90%) React
2 106 (11.47%) Node.js
3 94 (10.17%) Tailwind CSS
4 93 (10.06%) REST
5 90 (9.74%) AngularJS
6 79 (8.55%) HTML
7 67 (7.25%) CSS
8 27 (2.92%) XML
9 25 (2.71%) .NET
10 24 (2.60%) CSS3
11 14 (1.52%) Web Services
12 11 (1.19%) ASP.NET
13 9 (0.97%) jQuery
14 8 (0.87%) gRPC
14 8 (0.87%) HTML5
15 6 (0.65%) Lightning Web Components
16 5 (0.54%) Flask
16 5 (0.54%) Sass
17 4 (0.43%) Shiny
17 4 (0.43%) Vue
Miscellaneous
1 173 (18.72%) Social Media
2 133 (14.39%) Digital Media
3 125 (13.53%) Blog
4 45 (4.87%) Self-Motivation
5 43 (4.65%) Mobile App
6 38 (4.11%) Product Ownership
7 29 (3.14%) Marketing Technology
8 25 (2.71%) Blockchain
8 25 (2.71%) Graphic Design
9 22 (2.38%) Analytical Mindset
9 22 (2.38%) Management Information System
10 20 (2.16%) IoT
11 19 (2.06%) Video Editing
12 18 (1.95%) Enterprise Software
13 14 (1.52%) Onboarding
14 13 (1.41%) Life Science
15 12 (1.30%) Credit Risk
15 12 (1.30%) Photography
15 12 (1.30%) Reinsurance
16 11 (1.19%) Digital Signage
Operating Systems
1 21 (2.27%) Windows
2 8 (0.87%) Windows Vista
3 2 (0.22%) Android
3 2 (0.22%) Apple iOS
3 2 (0.22%) Linux
4 1 (0.11%) Unix
4 1 (0.11%) Windows Server
Processes & Methodologies
1 291 (31.49%) Agile
2 225 (24.35%) Analytics
3 208 (22.51%) Problem-Solving
4 187 (20.24%) CRM
5 164 (17.75%) E-Commerce
6 162 (17.53%) Project Management
7 151 (16.34%) User Experience
8 145 (15.69%) Digital Marketing
9 135 (14.61%) Roadmaps
10 125 (13.53%) Scrum
11 119 (12.88%) Business Development
12 108 (11.69%) Software Engineering
13 106 (11.47%) Continuous Delivery
14 97 (10.50%) Full-Stack Development
15 92 (9.96%) Business Intelligence
16 90 (9.74%) Epics
17 79 (8.55%) Mentoring
18 75 (8.12%) Decision-Making
19 74 (8.01%) Actionable Insight
20 73 (7.90%) SEO
Programming Languages
1 109 (11.80%) TypeScript
2 100 (10.82%) SQL
3 86 (9.31%) Python
4 84 (9.09%) JavaScript
5 45 (4.87%) R
6 22 (2.38%) C#
7 14 (1.52%) C++
8 10 (1.08%) PHP
9 5 (0.54%) Java
9 5 (0.54%) T-SQL
10 4 (0.43%) Go
11 3 (0.32%) Ruby
12 2 (0.22%) C
12 2 (0.22%) Data Analysis Expressions
12 2 (0.22%) Kotlin
12 2 (0.22%) Scala
13 1 (0.11%) Apex Code
13 1 (0.11%) Bash
13 1 (0.11%) Dart
13 1 (0.11%) SPARQL
Qualifications
1 172 (18.61%) Degree
2 38 (4.11%) DBS Check
3 32 (3.46%) Security Cleared
4 28 (3.03%) Computer Science Degree
5 27 (2.92%) SC Cleared
6 20 (2.16%) Master's Degree
7 10 (1.08%) MBA
7 10 (1.08%) Microsoft Certification
8 9 (0.97%) CISSP
9 8 (0.87%) CISM
10 7 (0.76%) APMG
10 7 (0.76%) CCIE
10 7 (0.76%) CCNP
10 7 (0.76%) CCSE
10 7 (0.76%) Cisco Certification
10 7 (0.76%) DV Cleared
11 5 (0.54%) HND
11 5 (0.54%) Numerate Degree
11 5 (0.54%) PMI Certification
11 5 (0.54%) PMP
Quality Assurance & Compliance
1 41 (4.44%) QA
2 29 (3.14%) Accessibility
3 23 (2.49%) GDPR
4 20 (2.16%) Data Quality
5 11 (1.19%) Good Clinical Practice
6 8 (0.87%) PCI DSS
7 7 (0.76%) ISO/IEC 27001
8 6 (0.65%) NIST
8 6 (0.65%) PERC
9 5 (0.54%) Actionable Recommendations
9 5 (0.54%) GAAP
9 5 (0.54%) IFRS
9 5 (0.54%) PMO
10 4 (0.43%) Cyber Essentials
10 4 (0.43%) Cyber Essentials PLUS
10 4 (0.43%) GRC
10 4 (0.43%) ITGC
10 4 (0.43%) WCAG
11 2 (0.22%) SLA
12 1 (0.11%) MiFID
System Software
1 108 (11.69%) Docker
2 2 (0.22%) Active Directory
3 1 (0.11%) Firmware
Systems Management
1 106 (11.47%) Kubernetes
2 7 (0.76%) Terraform
3 2 (0.22%) Systems Management Server (SMS)
4 1 (0.11%) Kubeflow
4 1 (0.11%) Prometheus
Vendors
1 147 (15.91%) Google
2 113 (12.23%) Microsoft
3 98 (10.61%) Adobe
4 66 (7.14%) Salesforce
5 44 (4.76%) SAP
6 32 (3.46%) Facebook
7 31 (3.35%) Instagram
8 23 (2.49%) YouTube
9 18 (1.95%) TikTok
10 17 (1.84%) Databricks
11 14 (1.52%) Ahrefs
11 14 (1.52%) HubSpot
11 14 (1.52%) Salesforce Marketing Cloud
12 13 (1.41%) Screaming Frog
13 12 (1.30%) Pinterest
14 10 (1.08%) Fortinet
14 10 (1.08%) Marketo
15 9 (0.97%) Cisco
15 9 (0.97%) F5
16 8 (0.87%) Sitecore