Asset Management Jobs in London

Asset Management
England > London

The table below provides summary statistics for permanent job vacancies advertised in London requiring Asset Management skills. It includes a benchmarking guide to the annual salaries offered in vacancies that cited Asset Management over the 6 months leading up to 25 April 2025, comparing them to the same period in the previous two years.

6 months to
25 Apr 2025
Same period 2024 Same period 2023
Rank 27 48 87
Rank change year-on-year +21 +39 +28
Permanent jobs citing Asset Management 1,092 1,166 1,350
As % of all permanent jobs advertised in London 8.32% 4.96% 3.73%
As % of the Processes & Methodologies category 8.66% 5.42% 3.91%
Number of salaries quoted 561 975 983
10th Percentile £71,250 £51,250 £45,000
25th Percentile £85,000 £75,000 £62,500
Median annual salary (50th Percentile) £110,000 £105,000 £90,000
Median % change year-on-year +4.76% +16.67% -5.26%
75th Percentile £136,250 £138,750 £133,750
90th Percentile £140,000 £148,750 £151,250
England median annual salary £95,000 £80,000 £75,000
% change year-on-year +18.75% +6.67% -14.29%

All Process and Methodology Skills
London

Asset Management falls under the Processes and Methodologies category. For comparison with the information above, the following table provides summary statistics for all permanent job vacancies requiring process or methodology skills in London.

Permanent vacancies with a requirement for process or methodology skills 12,614 21,520 34,512
As % of all permanent jobs advertised in London 96.11% 91.46% 95.44%
Number of salaries quoted 7,571 16,076 24,614
10th Percentile £42,500 £38,000 £43,750
25th Percentile £56,250 £52,500 £55,000
Median annual salary (50th Percentile) £75,000 £70,576 £75,000
Median % change year-on-year +6.27% -5.90% +7.14%
75th Percentile £100,000 £95,000 £95,000
90th Percentile £122,500 £115,000 £115,000
England median annual salary £57,560 £55,000 £62,500
% change year-on-year +4.65% -12.00% +4.17%

Asset Management
Job Vacancy Trend in London

Job postings citing Asset Management as a proportion of all IT jobs advertised in London.
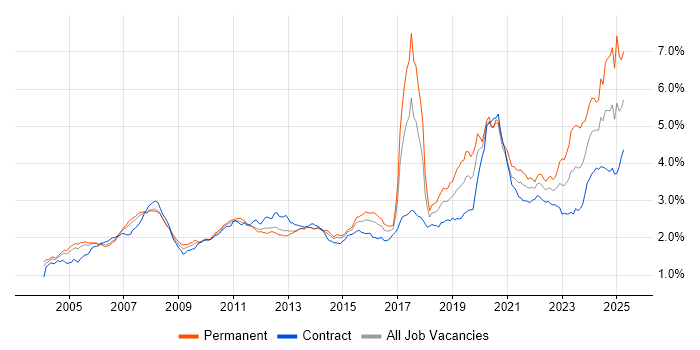
Job vacancy trend for Asset Management in London

Asset Management
Salary Trend in London

3-month moving average salary quoted in jobs citing Asset Management in London.

Salary trend for Asset Management in London

Asset Management
Salary Histogram in London

Salary distribution for jobs citing Asset Management in London over the 6 months to 25 April 2025.

Salary histogram for Asset Management in London

Asset Management
Job Locations in London

The table below looks at the demand and provides a guide to the median salaries quoted in IT jobs citing Asset Management within the London region over the 6 months to 25 April 2025. The 'Rank Change' column provides an indication of the change in demand within each location based on the same 6 month period last year.

Location Rank Change
on Same Period
Last Year
Matching
Permanent
IT Job Ads
Median Salary
Past 6 Months
Median Salary
% Change
on Same Period
Last Year
Live
Jobs
South London +77 138 £26,000 -35.00% 11
North London - 87 - -
West London +76 86 - - 6
East London +26 47 £38,750 -64.77% 5
Central London +16 42 £50,000 -30.56% 20
Asset Management
England

Asset Management
Co-occurring Skills and Capabilities in London by Category

The follow tables expand on the table above by listing co-occurrences grouped by category. The same employment type, locality and period is covered with up to 20 co-occurrences shown in each of the following categories:

Application Platforms
1 269 (24.63%) Apache Airflow
2 202 (18.50%) Apache
3 80 (7.33%) Apache Spark
4 11 (1.01%) nginx
5 8 (0.73%) SharePoint
6 6 (0.55%) CMS
7 4 (0.37%) Microsoft Exchange
8 3 (0.27%) Confluence
9 1 (0.092%) Ethereum
9 1 (0.092%) IIS
9 1 (0.092%) SAS
9 1 (0.092%) Solana
Applications
1 393 (35.99%) Microsoft PowerPoint
2 21 (1.92%) Microsoft Office
3 16 (1.47%) Microsoft Excel
4 8 (0.73%) Chatbot
5 7 (0.64%) Maya
6 2 (0.18%) InDesign
7 1 (0.092%) AutoCAD
7 1 (0.092%) Microsoft Project
7 1 (0.092%) MS Visio
7 1 (0.092%) Revit
Business Applications
1 60 (5.49%) Aladdin
2 26 (2.38%) thinkFolio
3 13 (1.19%) SAP S/4HANA
4 7 (0.64%) SAP IBP
5 3 (0.27%) Maximo
5 3 (0.27%) Salesforce CRM
5 3 (0.27%) SAP PM
6 2 (0.18%) Dynamics CRM
6 2 (0.18%) Oracle General Ledger
6 2 (0.18%) Oracle Payables
6 2 (0.18%) Oracle Receivables
6 2 (0.18%) SAP Oil and Gas
7 1 (0.092%) Distributed Ledger
7 1 (0.092%) Finacle
7 1 (0.092%) NEC Housing
7 1 (0.092%) Teamcenter
Cloud Services
1 435 (39.84%) AWS
2 256 (23.44%) dbt
3 222 (20.33%) GCP
4 142 (13.00%) Amazon ECS
5 137 (12.55%) Azure
6 114 (10.44%) Serverless
7 111 (10.16%) AWS Lambda
7 111 (10.16%) Snowflake
8 81 (7.42%) OpenShift
9 77 (7.05%) Amazon EC2
10 59 (5.40%) Dagster
11 48 (4.40%) Amazon S3
12 36 (3.30%) Amazon SQS
12 36 (3.30%) AWS CloudFormation
13 35 (3.21%) Amazon EKS
14 29 (2.66%) Microsoft 365
15 27 (2.47%) Power Platform
16 16 (1.47%) SaaS
17 11 (1.01%) Cloud Computing
18 10 (0.92%) GitHub
Communications & Networking
1 9 (0.82%) Firewall
2 4 (0.37%) DNS
2 4 (0.37%) VPN
3 2 (0.18%) Network Security
3 2 (0.18%) Remote Desktop
3 2 (0.18%) VLAN
3 2 (0.18%) Wireless
4 1 (0.092%) Cisco Nexus
4 1 (0.092%) DHCP
4 1 (0.092%) Ethernet
4 1 (0.092%) HTTP
4 1 (0.092%) Internet
4 1 (0.092%) Intrusion Detection
4 1 (0.092%) Kerberos
4 1 (0.092%) Modbus
4 1 (0.092%) OpenLDAP
4 1 (0.092%) SAN
4 1 (0.092%) SSL
4 1 (0.092%) TCP/IP
Database & Business Intelligence
1 261 (23.90%) Amazon Athena
2 256 (23.44%) Apache Iceberg
2 256 (23.44%) Dremio
3 229 (20.97%) Apache Arrow
4 167 (15.29%) Apache Ignite
5 107 (9.80%) Data Lake
6 67 (6.14%) PostgreSQL
7 46 (4.21%) Amazon Redshift
8 36 (3.30%) Amazon RDS
9 33 (3.02%) Metadata
10 26 (2.38%) Power BI
11 19 (1.74%) Data Warehouse
12 18 (1.65%) Tableau
13 14 (1.28%) SQL Server
14 13 (1.19%) NoSQL
15 9 (0.82%) Apache Hive
15 9 (0.82%) Hadoop
15 9 (0.82%) IBM InfoSphere
16 7 (0.64%) SAP BW
17 6 (0.55%) GIS
Development Applications
1 81 (7.42%) Artifactory
2 17 (1.56%) Jenkins
3 12 (1.10%) Git
4 8 (0.73%) webpack
5 7 (0.64%) JIRA
6 6 (0.55%) Grunt
6 6 (0.55%) Jasmine
6 6 (0.55%) Mocha
7 5 (0.46%) CircleCI
8 2 (0.18%) Sonatype Nexus
8 2 (0.18%) Vite
9 1 (0.092%) GitLab
9 1 (0.092%) Maven
General
1 968 (88.64%) Finance
2 636 (58.24%) Banking
3 479 (43.86%) Social Skills
4 457 (41.85%) Inclusion and Diversity
5 456 (41.76%) Analytical Skills
6 436 (39.93%) Front Office
7 427 (39.10%) Financial Institution
8 393 (35.99%) French Language
8 393 (35.99%) German Language
9 102 (9.34%) Investment Banking
10 48 (4.40%) Retail Banking
11 23 (2.11%) Law
12 14 (1.28%) Marketing
13 13 (1.19%) Games
14 8 (0.73%) Automotive
14 8 (0.73%) Manufacturing
14 8 (0.73%) Organisational Skills
14 8 (0.73%) Telecoms
15 5 (0.46%) Public Sector
16 3 (0.27%) Presentation Skills
Job Titles
1 512 (46.89%) Analyst
2 393 (35.99%) Credit Analyst
2 393 (35.99%) Research Analyst
3 267 (24.45%) AWS Engineer
4 232 (21.25%) Python Engineer
5 207 (18.96%) Software Engineer
6 180 (16.48%) Developer
7 158 (14.47%) AWS Software Engineer
8 136 (12.45%) Developer/Software Engineer
9 130 (11.90%) Senior
10 111 (10.16%) DevOps Engineer
11 110 (10.07%) Python Software Engineer
12 109 (9.98%) AWS DevOps
12 109 (9.98%) AWS DevOps Engineer
13 102 (9.34%) Data Engineer
14 89 (8.15%) AWS Developer
15 84 (7.69%) Java Engineer
15 84 (7.69%) Java Software Engineer
16 80 (7.33%) Business Analyst
17 73 (6.68%) Business Manager
Libraries, Frameworks & Software Standards
1 167 (15.29%) PySpark
2 160 (14.65%) NumPy
3 156 (14.29%) Pandas
4 155 (14.19%) SciPy
5 131 (12.00%) React
6 97 (8.88%) Node.js
7 96 (8.79%) gRPC
7 96 (8.79%) Protocol Buffers
8 90 (8.24%) AngularJS
9 81 (7.42%) J2EE
10 79 (7.23%) Kafka
11 78 (7.14%) Vue
12 77 (7.05%) Redux
13 20 (1.83%) CSS
14 16 (1.47%) .NET
14 16 (1.47%) RESTful
15 14 (1.28%) HTML
16 11 (1.01%) OAuth
17 8 (0.73%) MobX
17 8 (0.73%) Sass
Miscellaneous
1 704 (64.47%) Fixed Income
2 393 (35.99%) Credit Risk
3 203 (18.59%) Hedge funds
4 189 (17.31%) Derivative
4 189 (17.31%) Equities
5 171 (15.66%) Foreign Exchange (FX)
6 64 (5.86%) Product Ownership
7 38 (3.48%) Onboarding
8 35 (3.21%) Pricing Data
9 14 (1.28%) Management Information System
10 12 (1.10%) Data Structures
10 12 (1.10%) Legacy Systems
11 11 (1.01%) Analytical Mindset
11 11 (1.01%) Cloud Native
11 11 (1.01%) Distributed Applications
12 10 (0.92%) Tandem
13 9 (0.82%) CMDB
14 8 (0.73%) PMI
14 8 (0.73%) Video on Demand
15 7 (0.64%) Enterprise Software
Operating Systems
1 39 (3.57%) Apple iOS
2 22 (2.01%) Windows
3 20 (1.83%) Linux
4 9 (0.82%) Windows Server
5 8 (0.73%) Mac OS
6 7 (0.64%) Windows 10
7 6 (0.55%) Android
8 3 (0.27%) Windows Server 2012
8 3 (0.27%) Windows Server 2019
9 2 (0.18%) Red Hat Enterprise Linux
10 1 (0.092%) CentOS
10 1 (0.092%) Debian
10 1 (0.092%) Ubuntu
10 1 (0.092%) Windows Server 2016
Processes & Methodologies
1 541 (49.54%) Agile
2 488 (44.69%) Portfolio Management
3 439 (40.20%) Risk Management
4 425 (38.92%) Decision-Making
5 415 (38.00%) Business Strategy
5 415 (38.00%) Credit Risk Analysis
6 404 (37.00%) Financial Modelling
7 393 (35.99%) Risk Assessment
8 348 (31.87%) Software Engineering
9 263 (24.08%) Investment Management
10 159 (14.56%) Fintech
11 146 (13.37%) DevOps
12 145 (13.28%) CI/CD
13 117 (10.71%) Analytics
14 110 (10.07%) Site Reliability Engineering
15 107 (9.80%) Data Engineering
16 81 (7.42%) Open Source
16 81 (7.42%) Roadmaps
17 72 (6.59%) Migration
18 71 (6.50%) Order Management
Programming Languages
1 419 (38.37%) Python
2 235 (21.52%) Java
2 235 (21.52%) JavaScript
3 183 (16.76%) TypeScript
4 129 (11.81%) SQL
5 81 (7.42%) Go
6 17 (1.56%) C#
7 9 (0.82%) Bash
8 8 (0.73%) PowerShell
8 8 (0.73%) Shell Script
9 5 (0.46%) Scala
10 3 (0.27%) C++
10 3 (0.27%) R
10 3 (0.27%) T-SQL
11 2 (0.18%) Rust
11 2 (0.18%) VBA
Qualifications
1 471 (43.13%) Degree
2 400 (36.63%) Master's Degree
3 393 (35.99%) CFA
4 25 (2.29%) AWS Certification
4 25 (2.29%) Azure Certification
5 10 (0.92%) Security Cleared
6 9 (0.82%) PMI Certification
7 8 (0.73%) SC Cleared
8 7 (0.64%) Computer Science Degree
9 6 (0.55%) Microsoft Certification
10 5 (0.46%) MCSA
11 4 (0.37%) PhD
12 3 (0.27%) ACCA
12 3 (0.27%) CIMA
12 3 (0.27%) CISA
12 3 (0.27%) CISM
13 2 (0.18%) CCAB
13 2 (0.18%) DV Cleared
13 2 (0.18%) PMP
14 1 (0.092%) APMP
Quality Assurance & Compliance
1 28 (2.56%) Accessibility
2 18 (1.65%) Data Quality
3 17 (1.56%) GDPR
4 11 (1.01%) SLA
5 10 (0.92%) Sarbanes-Oxley
6 6 (0.55%) Cyber Essentials
6 6 (0.55%) WCAG
7 5 (0.46%) QA
8 3 (0.27%) ISO/IEC 27001
8 3 (0.27%) MiFID
8 3 (0.27%) NIST
9 2 (0.18%) ISO 22301
9 2 (0.18%) ISO 9001
9 2 (0.18%) PCI DSS
9 2 (0.18%) PMO
10 1 (0.092%) Basel III
10 1 (0.092%) PSD2
10 1 (0.092%) Solvency II
System Software
1 130 (11.90%) Docker
2 22 (2.01%) Active Directory
3 11 (1.01%) VMware Infrastructure
4 5 (0.46%) Apache Flume
5 3 (0.27%) Hyper-V
5 3 (0.27%) Virtual Desktop
6 2 (0.18%) Virtual Servers
7 1 (0.092%) BitLocker
7 1 (0.092%) Virtual Machines
7 1 (0.092%) VMware ESXi
Systems Management
1 125 (11.45%) Kubernetes
2 114 (10.44%) Terraform
3 17 (1.56%) Microsoft Intune
4 10 (0.92%) SCCM
5 5 (0.46%) Oozie
6 4 (0.37%) Single Sign-On
7 2 (0.18%) Ansible
7 2 (0.18%) Puppet
8 1 (0.092%) Active Directory Federation Services
8 1 (0.092%) Argo
8 1 (0.092%) Graylog
8 1 (0.092%) Nagios
8 1 (0.092%) Nessus
8 1 (0.092%) Packer
8 1 (0.092%) Progress Chef
8 1 (0.092%) Rundeck
8 1 (0.092%) SCOM
8 1 (0.092%) WMI
Vendors
1 394 (36.08%) Bloomberg
2 98 (8.97%) Microsoft
3 47 (4.30%) BISAM
4 43 (3.94%) Charles River
5 27 (2.47%) SimCorp
6 26 (2.38%) Calypso
7 22 (2.01%) SAP
8 19 (1.74%) ServiceNow
9 15 (1.37%) VMware
10 11 (1.01%) Apple
10 11 (1.01%) Google
10 11 (1.01%) IBM
11 9 (0.82%) Informatica
12 7 (0.64%) Ariba
13 6 (0.55%) eFront
13 6 (0.55%) Oracle
14 5 (0.46%) Cloudera
14 5 (0.46%) Databricks
14 5 (0.46%) Salesforce
15 3 (0.27%) Xero