Fintech Jobs in London

Financial Technology (FinTech)
England > London

The table below provides summary statistics for permanent job vacancies advertised in London requiring Fintech skills. It includes a benchmarking guide to the annual salaries offered in vacancies that cited Fintech over the 6 months leading up to 23 May 2025, comparing them to the same period in the previous two years.

6 months to
23 May 2025
Same period 2024 Same period 2023
Rank 64 55 45
Rank change year-on-year -9 -10 +2
Permanent jobs citing Fintech 582 1,070 1,974
As % of all permanent jobs advertised in London 4.62% 4.53% 5.92%
As % of the Processes & Methodologies category 4.80% 4.98% 6.21%
Number of salaries quoted 442 885 1,723
10th Percentile £55,000 £55,000 £53,750
25th Percentile £76,250 £65,000 £67,500
Median annual salary (50th Percentile) £95,000 £85,000 £90,000
Median % change year-on-year +11.76% -5.56% +12.50%
75th Percentile £115,000 £107,500 £110,000
90th Percentile £137,500 £122,500 £125,000
England median annual salary £85,000 £77,500 £85,000
% change year-on-year +9.68% -8.82% +17.24%

All Process and Methodology Skills
London

Fintech falls under the Processes and Methodologies category. For comparison with the information above, the following table provides summary statistics for all permanent job vacancies requiring process or methodology skills in London.

Permanent vacancies with a requirement for process or methodology skills 12,123 21,474 31,809
As % of all permanent jobs advertised in London 96.25% 90.89% 95.33%
Number of salaries quoted 6,848 15,843 22,924
10th Percentile £42,000 £37,500 £43,000
25th Percentile £56,250 £51,401 £55,000
Median annual salary (50th Percentile) £75,000 £71,000 £75,000
Median % change year-on-year +5.63% -5.33% +7.14%
75th Percentile £100,000 £95,000 £95,000
90th Percentile £125,000 £115,000 £115,000
England median annual salary £57,500 £55,000 £62,500
% change year-on-year +4.55% -12.00% +4.17%

Fintech
Job Vacancy Trend in London

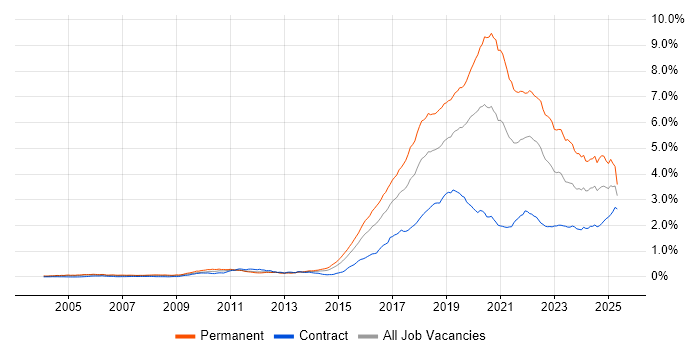
Job postings citing Fintech as a proportion of all IT jobs advertised in London.

Job vacancy trend for Fintech in London

Fintech
Salary Trend in London

3-month moving average salary quoted in jobs citing Fintech in London.

Salary trend for Fintech in London

Fintech
Salary Histogram in London

Salary distribution for jobs citing Fintech in London over the 6 months to 23 May 2025.

Salary histogram for Fintech in London

Fintech
Job Locations in London

The table below looks at the demand and provides a guide to the median salaries quoted in IT jobs citing Fintech within the London region over the 6 months to 23 May 2025. The 'Rank Change' column provides an indication of the change in demand within each location based on the same 6 month period last year.

Location Rank Change
on Same Period
Last Year
Matching
Permanent
IT Job Ads
Median Salary
Past 6 Months
Median Salary
% Change
on Same Period
Last Year
Live
Jobs
Central London -56 75 £85,000 - 148
South London +13 26 £82,500 +29.41% 5
East London -11 5 £80,000 -20.00% 16
West London +31 4 £40,000 - 175
North London -7 3 £95,000 +26.67% 1
Fintech
England

Fintech
Co-occurring Skills and Capabilities in London by Category

The follow tables expand on the table above by listing co-occurrences grouped by category. The same employment type, locality and period is covered with up to 20 co-occurrences shown in each of the following categories:

Application Platforms
1 72 (12.37%) Apache Airflow
2 18 (3.09%) Apache
3 16 (2.75%) Microsoft Exchange
4 11 (1.89%) nginx
5 10 (1.72%) Confluence
6 6 (1.03%) IIS
7 3 (0.52%) Apache Spark
8 2 (0.34%) SharePoint
9 1 (0.17%) Apache Pulsar
9 1 (0.17%) CMS
9 1 (0.17%) Luigi
9 1 (0.17%) Oracle Workflow
9 1 (0.17%) Solana
9 1 (0.17%) Traefik
Applications
1 14 (2.41%) Microsoft Excel
2 9 (1.55%) Microsoft PowerPoint
3 5 (0.86%) Adobe XD
4 4 (0.69%) Microsoft Office
5 3 (0.52%) Adobe Creative Suite
5 3 (0.52%) Sketch
5 3 (0.52%) UserZoom
6 2 (0.34%) MS Visio
6 2 (0.34%) Spreadsheet
7 1 (0.17%) Adobe After Effects
7 1 (0.17%) CINEMA 4D
7 1 (0.17%) Microsoft Project
Business Applications
1 4 (0.69%) Dynamics CRM
2 2 (0.34%) Payment Gateway
2 2 (0.34%) Refinitiv Enterprise Platform
3 1 (0.17%) Magento
3 1 (0.17%) Salesforce CRM
3 1 (0.17%) Shopify
3 1 (0.17%) Workfront
Cloud Services
1 253 (43.47%) AWS
2 140 (24.05%) GCP
3 93 (15.98%) Azure
4 79 (13.57%) dbt
5 63 (10.82%) SaaS
6 28 (4.81%) Serverless
7 23 (3.95%) Power Platform
8 21 (3.61%) AWS Lambda
8 21 (3.61%) Figma
9 18 (3.09%) GitHub
10 17 (2.92%) Pulumi
11 14 (2.41%) Amazon S3
12 13 (2.23%) AWS CloudFormation
13 12 (2.06%) Amazon EC2
14 10 (1.72%) Amazon ECS
14 10 (1.72%) Azure AKS
15 9 (1.55%) Amazon SQS
15 9 (1.55%) Dynamics 365
16 8 (1.37%) Microsoft 365
16 8 (1.37%) PowerApps
Communications & Networking
1 17 (2.92%) Firewall
2 7 (1.20%) Network Security
3 6 (1.03%) TCP/IP
4 3 (0.52%) HTTP
4 3 (0.52%) Internet
5 2 (0.34%) DNS
5 2 (0.34%) Multicast
5 2 (0.34%) VPN
6 1 (0.17%) DHCP
6 1 (0.17%) ICMP
6 1 (0.17%) Reverse Proxy
6 1 (0.17%) SWIFTNet
6 1 (0.17%) VLAN
Database & Business Intelligence
1 90 (15.46%) PostgreSQL
2 70 (12.03%) Amazon Athena
3 68 (11.68%) Apache Iceberg
3 68 (11.68%) Dremio
4 64 (11.00%) Apache Arrow
5 21 (3.61%) MySQL
6 20 (3.44%) SQL Server
7 19 (3.26%) MongoDB
7 19 (3.26%) Relational Database
8 18 (3.09%) Power BI
9 16 (2.75%) NoSQL
10 15 (2.58%) Apache Ignite
11 12 (2.06%) Azure SQL Database
12 10 (1.72%) Data Hub
12 10 (1.72%) DynamoDB
12 10 (1.72%) Redis
12 10 (1.72%) SQL CLR
13 9 (1.55%) Amazon RDS
14 8 (1.37%) Elasticsearch
14 8 (1.37%) Tableau
Development Applications
1 25 (4.30%) Git
1 25 (4.30%) JIRA
2 14 (2.41%) Jenkins
3 6 (1.03%) Cypress.io
3 6 (1.03%) Selenium
4 5 (0.86%) Cucumber
5 4 (0.69%) Maven
5 4 (0.69%) Postman
5 4 (0.69%) SoapUI
5 4 (0.69%) Vite
6 3 (0.52%) webpack
7 2 (0.34%) Appium
7 2 (0.34%) Bitbucket
7 2 (0.34%) CircleCI
7 2 (0.34%) git-flow
7 2 (0.34%) GitLab
7 2 (0.34%) Xcode
7 2 (0.34%) XCUITest
8 1 (0.17%) JUnit
8 1 (0.17%) Subversion
General
1 414 (71.13%) Finance
2 141 (24.23%) Social Skills
3 125 (21.48%) Front Office
4 98 (16.84%) Banking
5 73 (12.54%) Marketing
6 66 (11.34%) Analytical Skills
7 48 (8.25%) Inclusion and Diversity
8 45 (7.73%) Law
9 37 (6.36%) Financial Institution
10 17 (2.92%) Presentation Skills
11 15 (2.58%) Back Office
12 14 (2.41%) Investment Banking
13 13 (2.23%) Legal
14 7 (1.20%) Organisational Skills
14 7 (1.20%) Retail
14 7 (1.20%) Turkish Language
15 5 (0.86%) Advertising
15 5 (0.86%) Games
15 5 (0.86%) Influencing Skills
16 4 (0.69%) Publishing
Job Titles
1 207 (35.57%) Developer
2 195 (33.51%) Software Engineer
3 109 (18.73%) Senior
4 102 (17.53%) Developer/Software Engineer
5 79 (13.57%) Lead
6 74 (12.71%) AWS Engineer
7 64 (11.00%) AWS Developer
7 64 (11.00%) AWS Software Engineer
7 64 (11.00%) Python Engineer
8 55 (9.45%) Python Developer
8 55 (9.45%) Python Software Engineer
9 53 (9.11%) Java Engineer
10 49 (8.42%) Java Software Engineer
11 32 (5.50%) Java Developer
12 28 (4.81%) Senior Software Engineer
13 26 (4.47%) Analyst
13 26 (4.47%) React Developer
14 22 (3.78%) Lead Software Engineer
14 22 (3.78%) Senior Manager
15 21 (3.61%) Senior Developer
Libraries, Frameworks & Software Standards
1 158 (27.15%) React
2 122 (20.96%) AngularJS
3 107 (18.38%) Node.js
4 90 (15.46%) Vue
5 70 (12.03%) Pandas
6 67 (11.51%) NumPy
7 66 (11.34%) SciPy
8 51 (8.76%) Redux
9 48 (8.25%) Kafka
10 42 (7.22%) HTML
11 41 (7.04%) CSS
11 41 (7.04%) Spring
12 39 (6.70%) .NET
13 34 (5.84%) Spring Boot
14 25 (4.30%) Akka
15 21 (3.61%) .NET Framework
15 21 (3.61%) RESTful
16 19 (3.26%) REST
17 17 (2.92%) RxJava
18 16 (2.75%) .NET Core
Miscellaneous
1 101 (17.35%) Fixed Income
2 67 (11.51%) Foreign Exchange (FX)
3 58 (9.97%) Equities
4 44 (7.56%) Cloud Native
5 19 (3.26%) Public Cloud
6 18 (3.09%) Analytical Mindset
6 18 (3.09%) Product Ownership
7 17 (2.92%) Distributed Systems
7 17 (2.92%) Onboarding
8 16 (2.75%) Hedge funds
8 16 (2.75%) Mobile App
9 15 (2.58%) Algorithms
10 11 (1.89%) Social Media
10 11 (1.89%) Team-Oriented Environment
11 10 (1.72%) Private Cloud
12 8 (1.37%) Greenfield Project
12 8 (1.37%) Management Information System
13 7 (1.20%) Derivative
13 7 (1.20%) Enterprise Software
13 7 (1.20%) Mobile Banking
Operating Systems
1 46 (7.90%) Linux
2 35 (6.01%) Windows
3 15 (2.58%) Windows Server
4 10 (1.72%) Apple iOS
5 8 (1.37%) Android
6 5 (0.86%) Unix
7 3 (0.52%) VMS
8 1 (0.17%) Mac OS X
8 1 (0.17%) Windows 10
Processes & Methodologies
1 244 (41.92%) Agile
2 224 (38.49%) Software Engineering
3 131 (22.51%) Asset Management
4 102 (17.53%) Investment Management
5 98 (16.84%) CI/CD
6 89 (15.29%) Problem-Solving
7 77 (13.23%) Microservices
8 76 (13.06%) User Experience
9 72 (12.37%) DevOps
10 69 (11.86%) Risk Management
11 65 (11.17%) Performance Attribution
12 63 (10.82%) Analytics
12 63 (10.82%) TDD
13 53 (9.11%) Order Management
14 51 (8.76%) Low Latency
15 46 (7.90%) Full-Stack Development
16 42 (7.22%) Data Science
17 41 (7.04%) Mentoring
18 38 (6.53%) Artificial Intelligence
19 36 (6.19%) BDD
Programming Languages
1 198 (34.02%) Python
2 168 (28.87%) JavaScript
3 153 (26.29%) TypeScript
4 117 (20.10%) Java
5 111 (19.07%) SQL
6 42 (7.22%) C#
7 29 (4.98%) C++
8 28 (4.81%) Go
9 21 (3.61%) C
10 20 (3.44%) PowerShell
11 16 (2.75%) Bicep
11 16 (2.75%) Kotlin
11 16 (2.75%) PHP
12 11 (1.89%) Bash
13 9 (1.55%) T-SQL
14 8 (1.37%) Ruby
14 8 (1.37%) Rust
15 3 (0.52%) Swift
15 3 (0.52%) VBA
16 2 (0.34%) R
Qualifications
1 58 (9.97%) Degree
2 12 (2.06%) Computer Science Degree
3 7 (1.20%) Master's Degree
4 6 (1.03%) AWS Certification
5 4 (0.69%) CCSP
5 4 (0.69%) CEH
5 4 (0.69%) Cisco Certification
5 4 (0.69%) OSCP
5 4 (0.69%) PhD
6 3 (0.52%) AWS Certified Solutions Architect
6 3 (0.52%) CISSP
6 3 (0.52%) GCIH
7 2 (0.34%) MBA
7 2 (0.34%) PMI Certification
7 2 (0.34%) PMP
8 1 (0.17%) (ISC)2 CCSP
8 1 (0.17%) CISA
8 1 (0.17%) CISM
8 1 (0.17%) CRISC
8 1 (0.17%) ISO 27001 Lead Implementer
Quality Assurance & Compliance
1 15 (2.58%) QA
2 14 (2.41%) Accessibility
3 10 (1.72%) GDPR
4 7 (1.20%) ISO/IEC 27001
5 5 (0.86%) Data Quality
5 5 (0.86%) NIST
6 4 (0.69%) PCI DSS
6 4 (0.69%) SLA
7 3 (0.52%) GAAP
7 3 (0.52%) SOC 2
8 2 (0.34%) COBIT
8 2 (0.34%) Cyber Essentials
8 2 (0.34%) GRC
9 1 (0.17%) Cyber Essentials PLUS
9 1 (0.17%) HIPAA
9 1 (0.17%) ISO 20022
9 1 (0.17%) PMO
9 1 (0.17%) PSD2
9 1 (0.17%) Sarbanes-Oxley
9 1 (0.17%) WCAG
System Software
1 90 (15.46%) Docker
2 13 (2.23%) VMware Infrastructure
3 3 (0.52%) Active Directory
3 3 (0.52%) Hyper-V
3 3 (0.52%) VMware ESXi
4 2 (0.34%) Virtual Desktop
5 1 (0.17%) HDFS
5 1 (0.17%) Virtual Machines
Systems Management
1 99 (17.01%) Kubernetes
2 56 (9.62%) Terraform
3 19 (3.26%) Ansible
4 17 (2.92%) Progress Chef
5 16 (2.75%) Podman
5 16 (2.75%) Puppet
6 15 (2.58%) Microsoft Intune
7 9 (1.55%) SCCM
8 5 (0.86%) Failover Clustering
8 5 (0.86%) Grafana
8 5 (0.86%) Prometheus
9 4 (0.69%) CASB
10 3 (0.52%) Argo
10 3 (0.52%) CSIRT
10 3 (0.52%) Kibana
10 3 (0.52%) logstash
10 3 (0.52%) Mesos
11 1 (0.17%) Check_MK
11 1 (0.17%) FortiGate
11 1 (0.17%) HAProxy
Vendors
1 30 (5.15%) Microsoft
2 22 (3.78%) Oracle
3 18 (3.09%) VMware
4 14 (2.41%) Adobe
5 12 (2.06%) Google
5 12 (2.06%) Palo Alto
6 6 (1.03%) Databricks
7 5 (0.86%) Citrix
7 5 (0.86%) Salesforce
8 3 (0.52%) Alibaba
8 3 (0.52%) Arista
8 3 (0.52%) Cisco
9 2 (0.34%) Atlassian
9 2 (0.34%) Bloomberg
9 2 (0.34%) Cribl.io
9 2 (0.34%) Refinitiv
10 1 (0.17%) CA Agile Central
10 1 (0.17%) OpenAI
10 1 (0.17%) Revolut
10 1 (0.17%) TikTok